Let’s Help Elon Musk Take a Deep Dive into Twitter’s Valuation
What’s interesting about Twitter is that it makes a better toy for Elon than an investment
Download the full report as a PDF
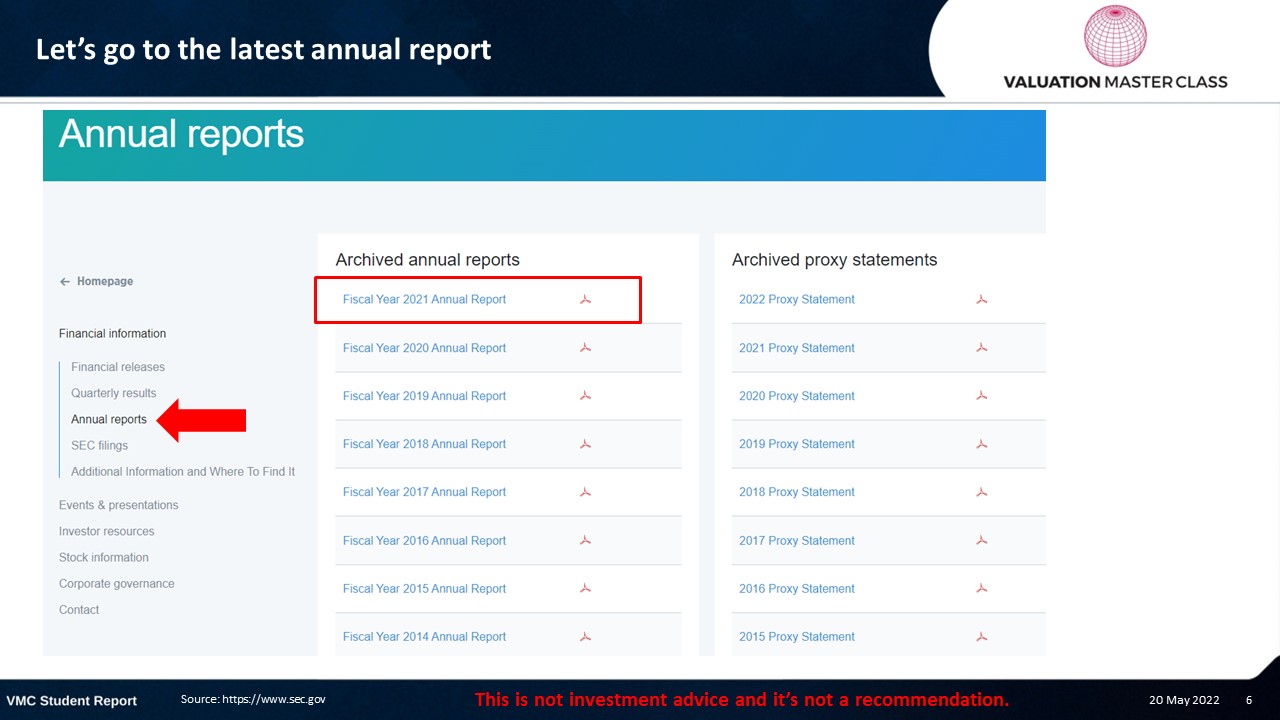
Let’s go to the latest annual report
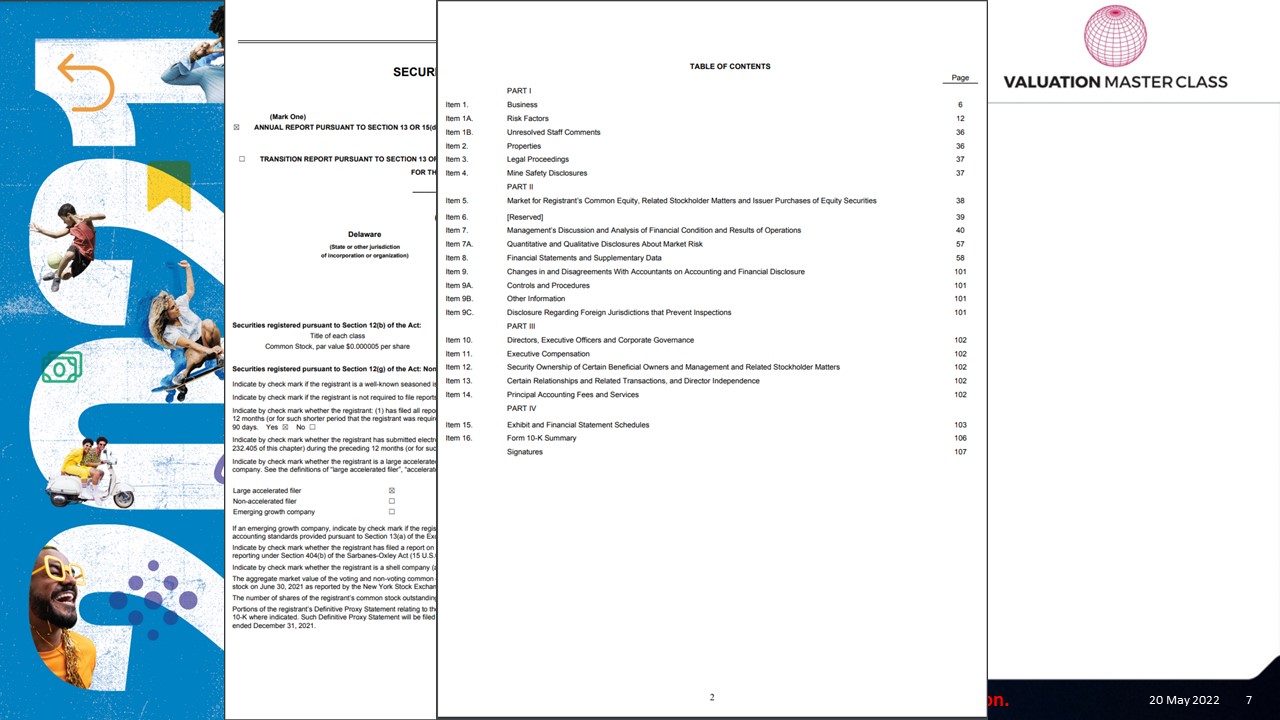
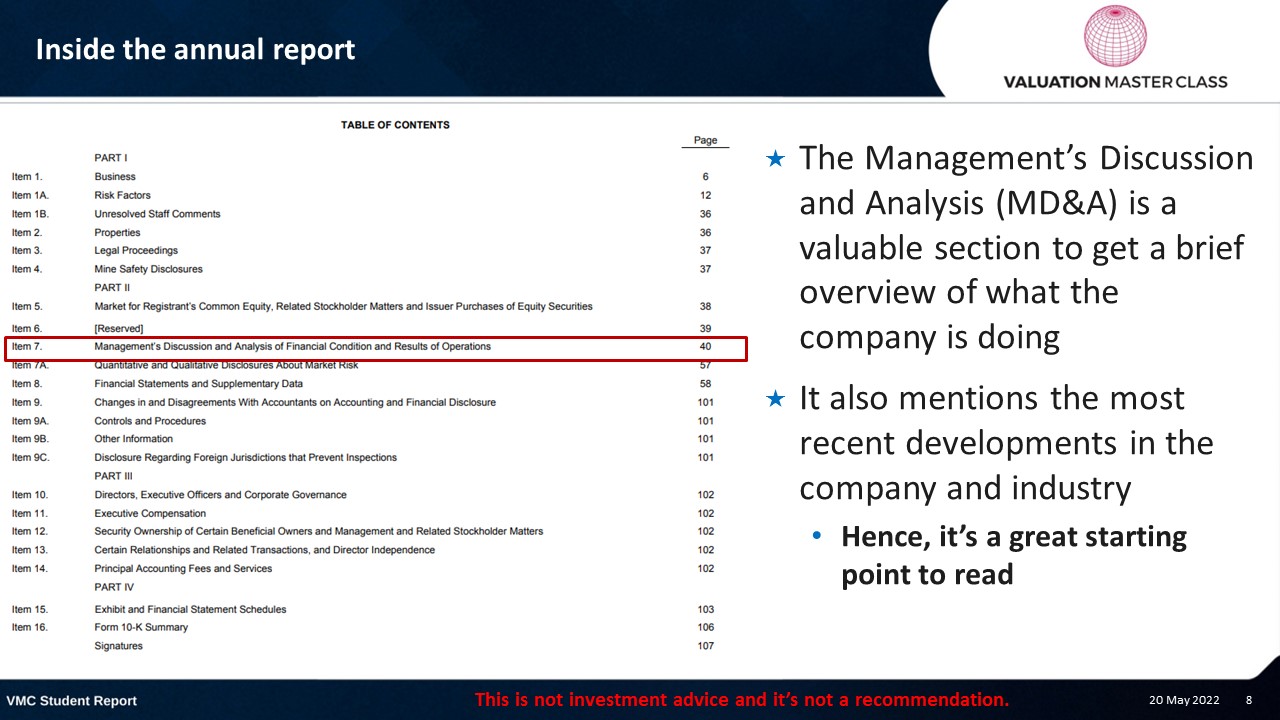
Inside the annual report
- The Management’s Discussion and Analysis (MD&A) is a valuable section to get a brief overview of what the company is doing
- It also mentions the most recent developments in the company and industry
- Hence, it’s a great starting point to read
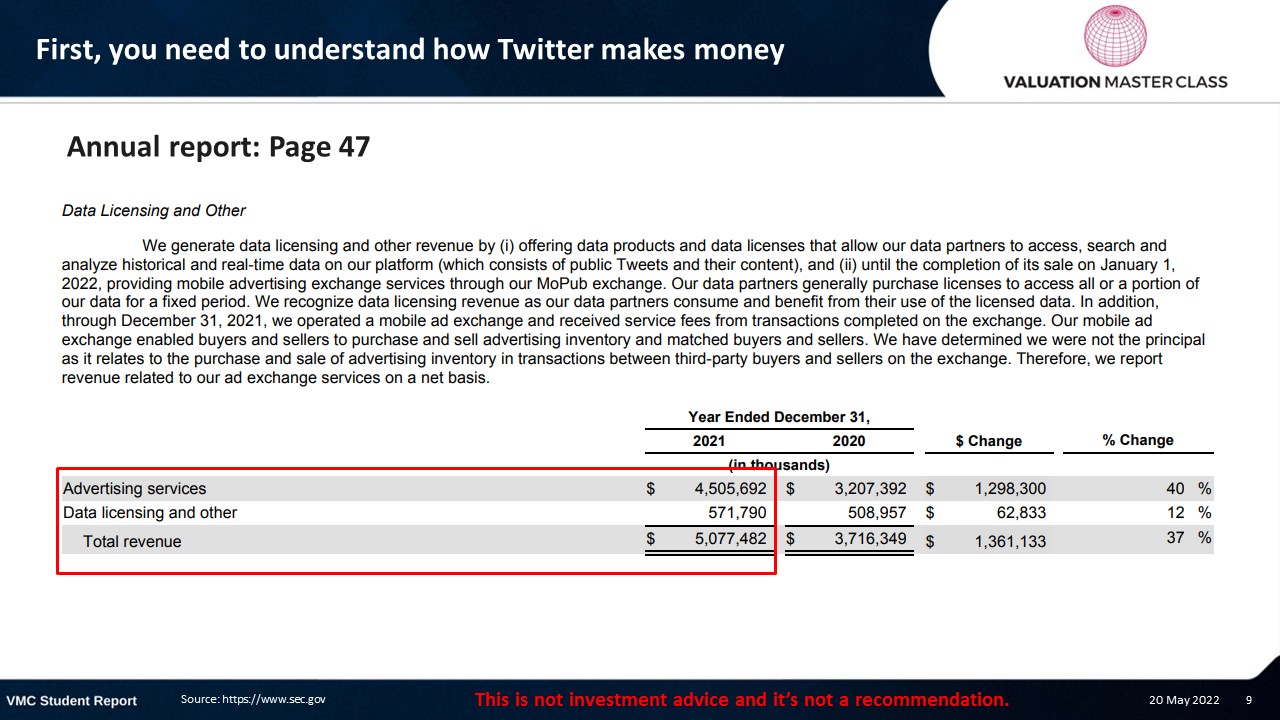
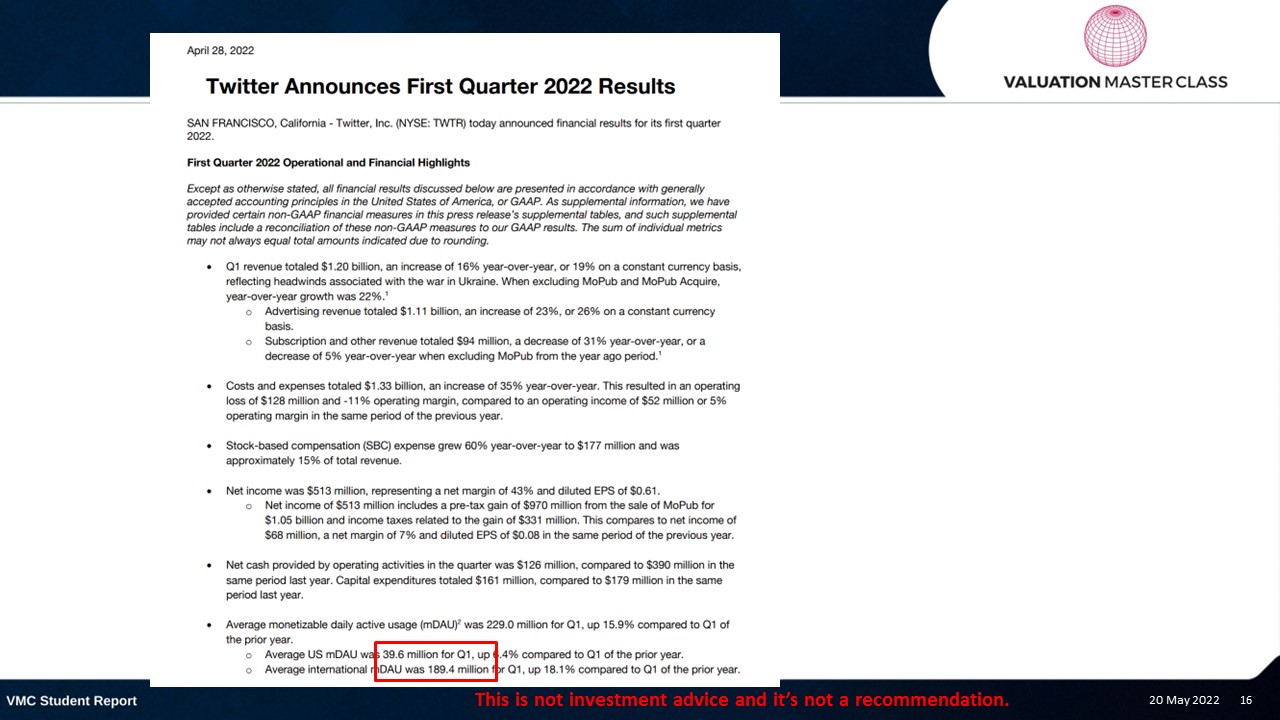
First, you need to understand how Twitter makes money
Let’s do a revenue breakdown of Twitter together
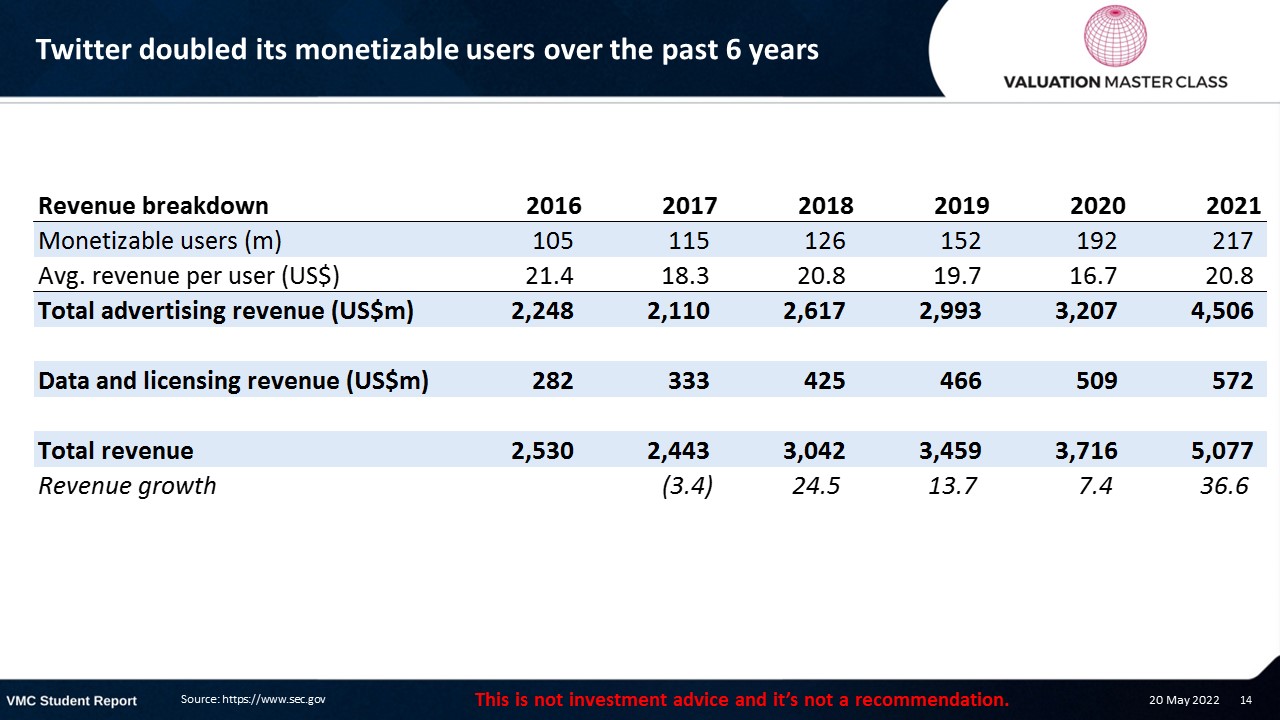
Main driver of Twitter’s revenue is quantity
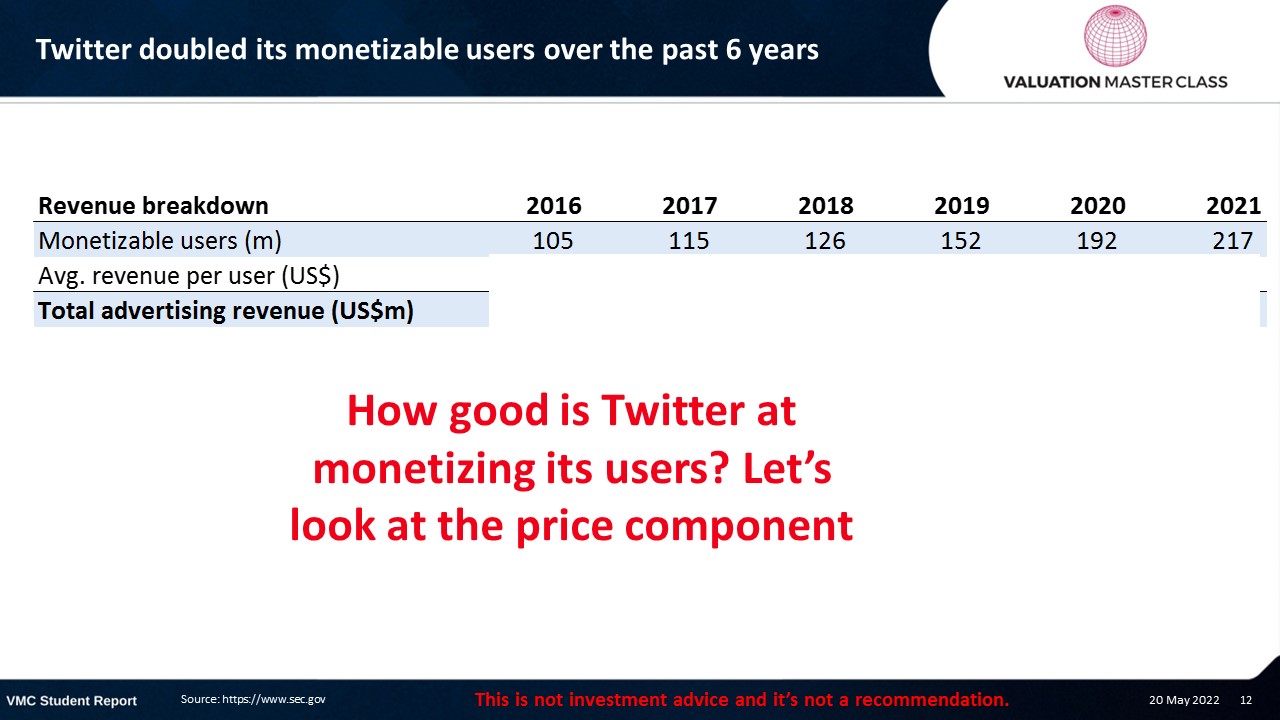
Twitter doubled its monetizable users over the past 6 years
Twitter had difficulties getting more money out of its users
Twitter doubled its monetizable users over the past 6 years
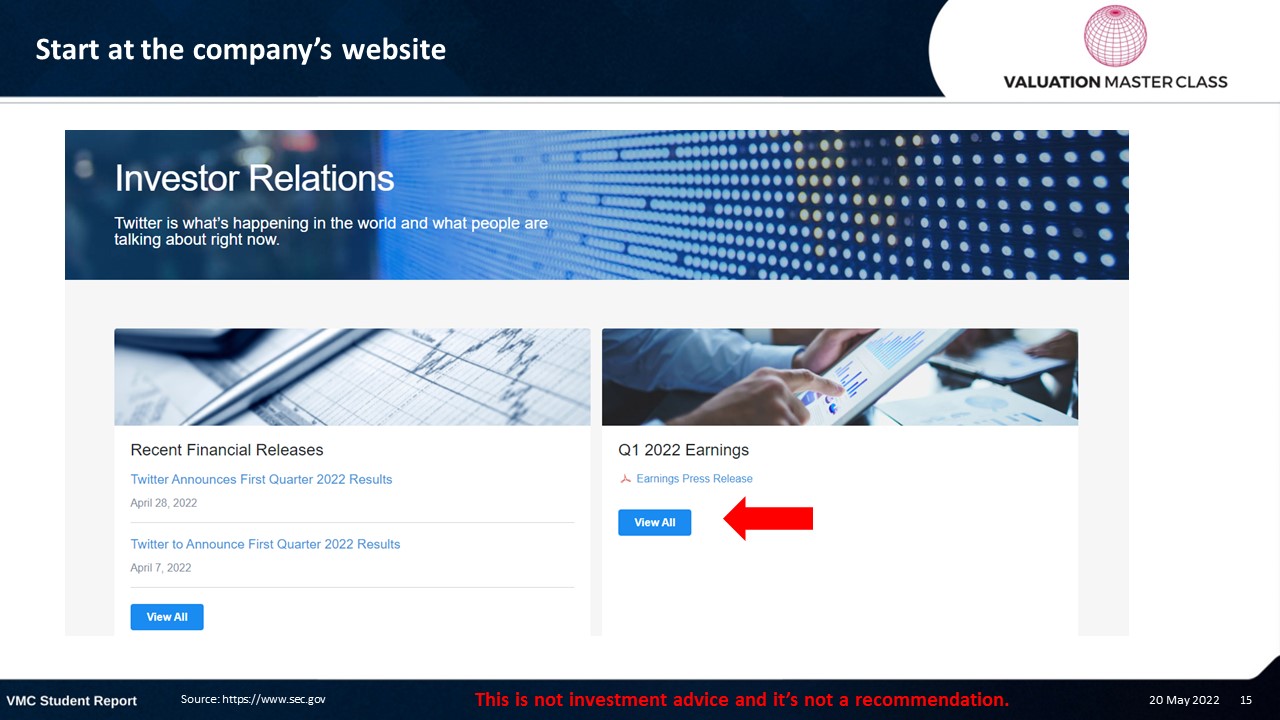
Start at the company’s website
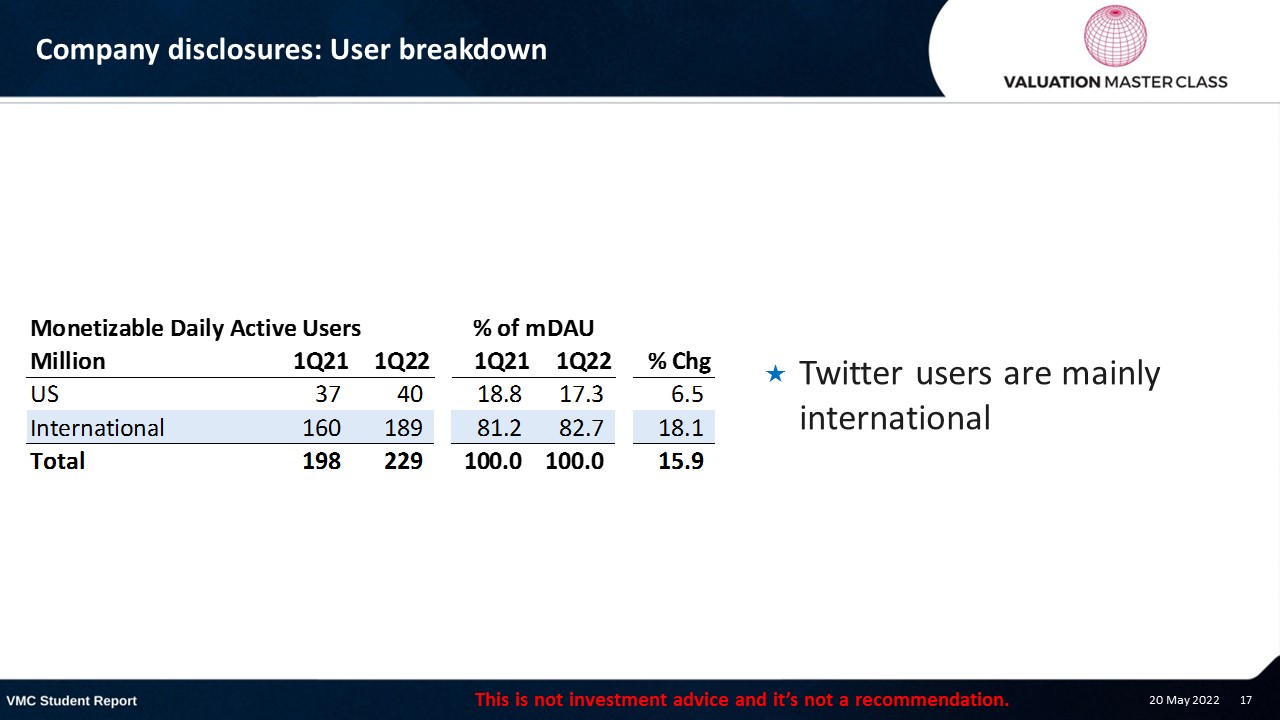
Company disclosures: User breakdown
- Twitter users are mainly international
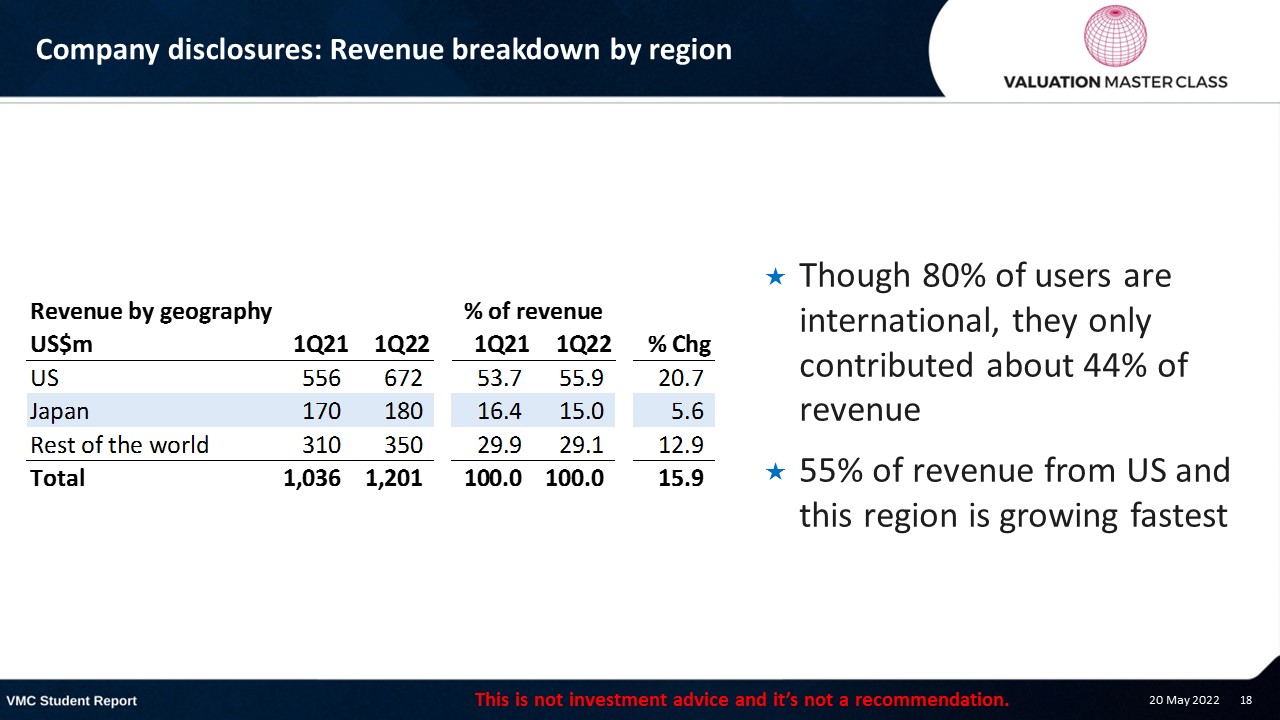
Company disclosures: Revenue breakdown by region
- Though 80% of users are international, they only contributed about 44% of revenue
- 55% of revenue from US and this region is growing fastest
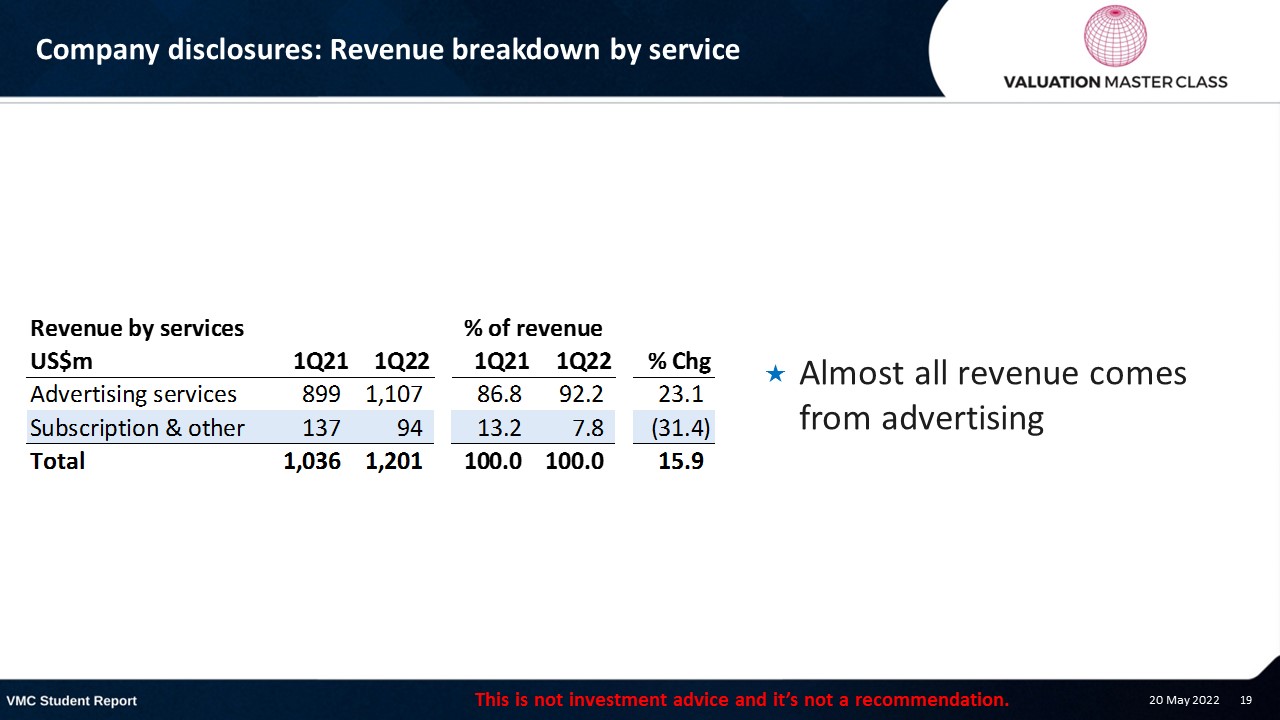
Company disclosures: Revenue breakdown by service
- Almost all revenue comes from advertising
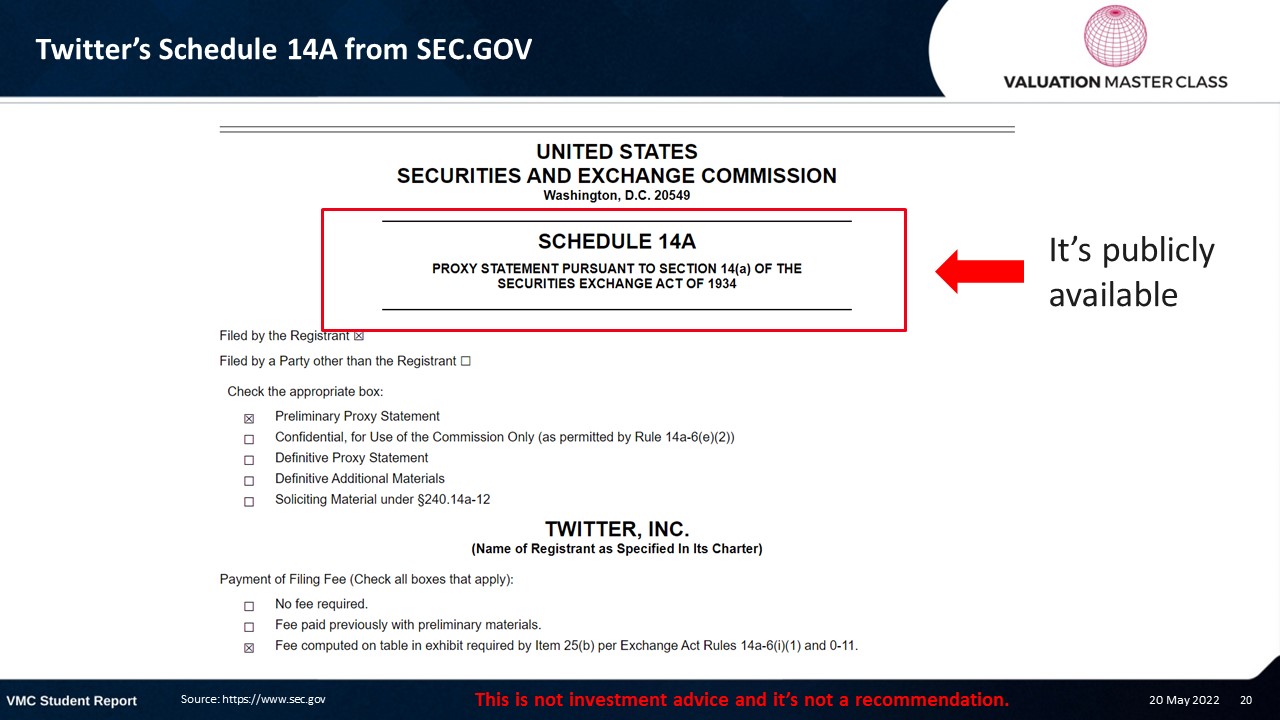
Twitter’s Schedule 14A from SEC.GOV
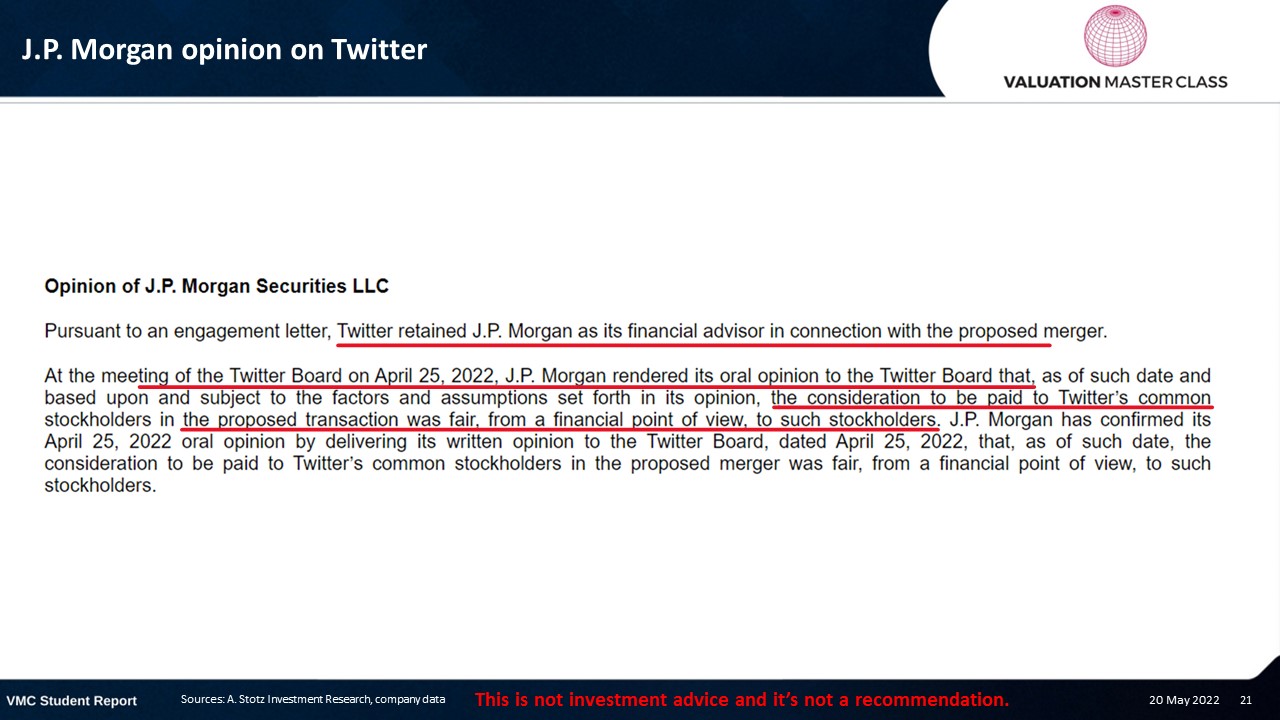
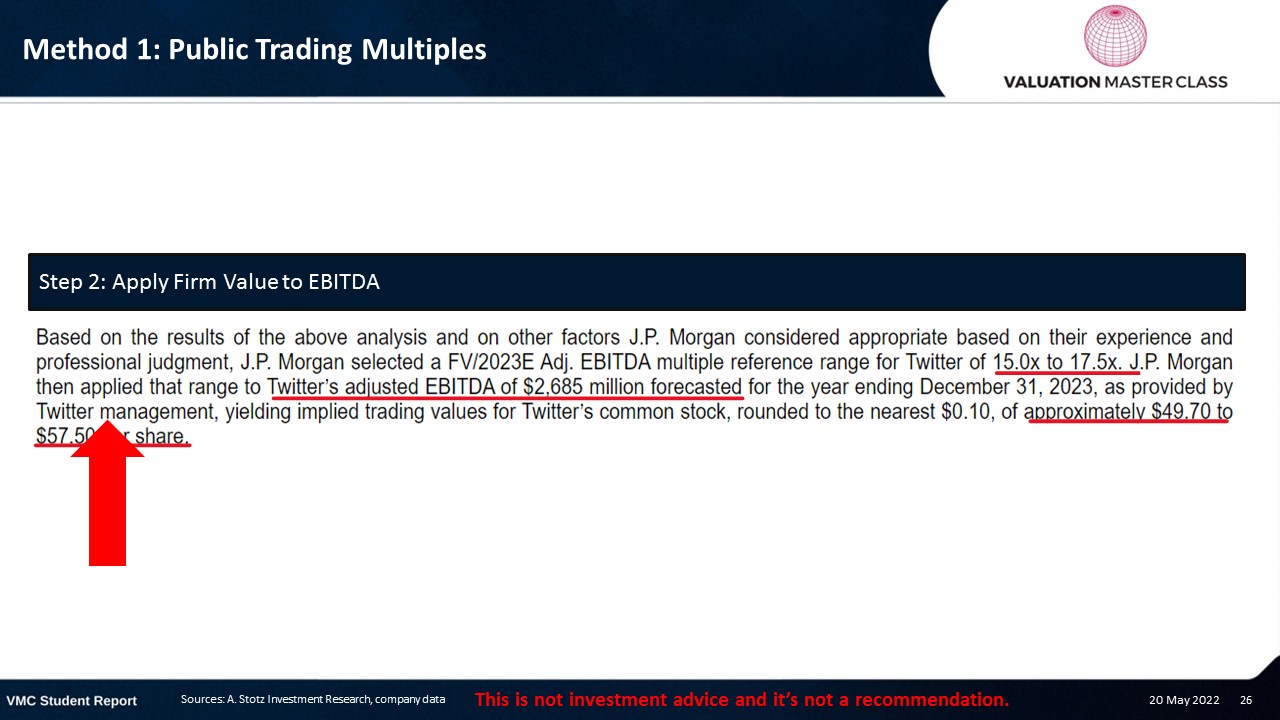
J.P. Morgan opinion on Twitter
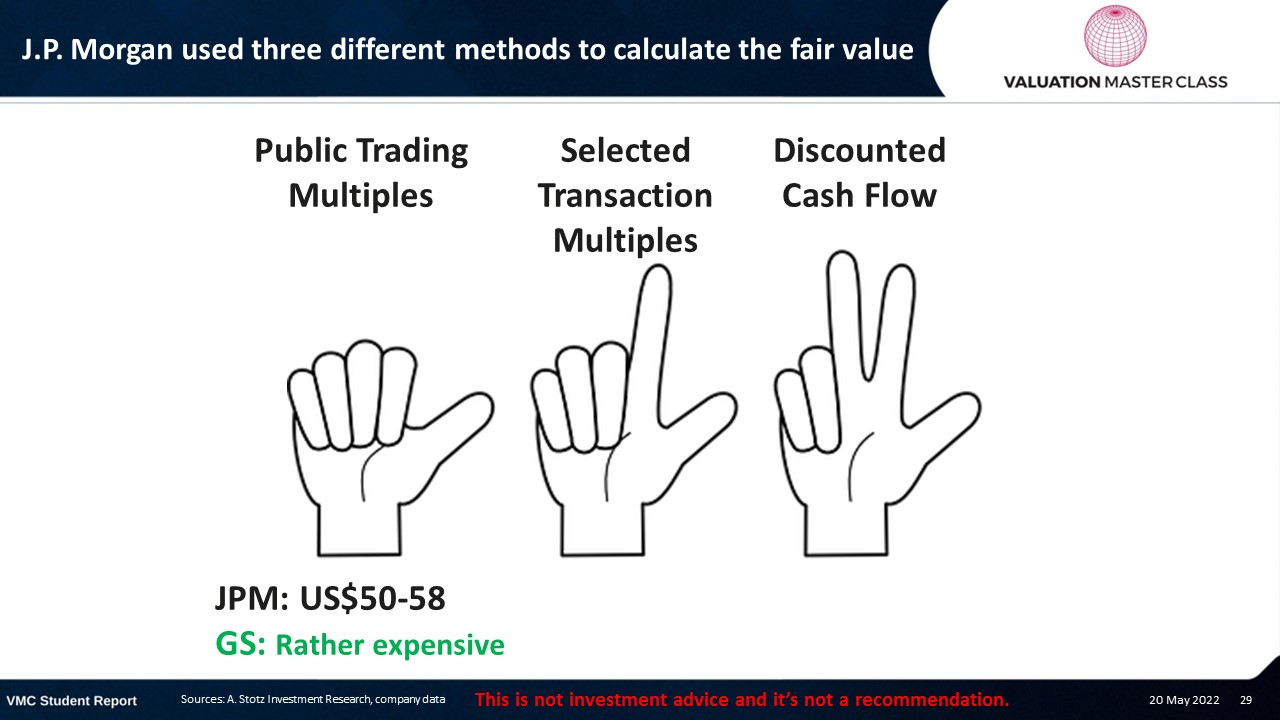
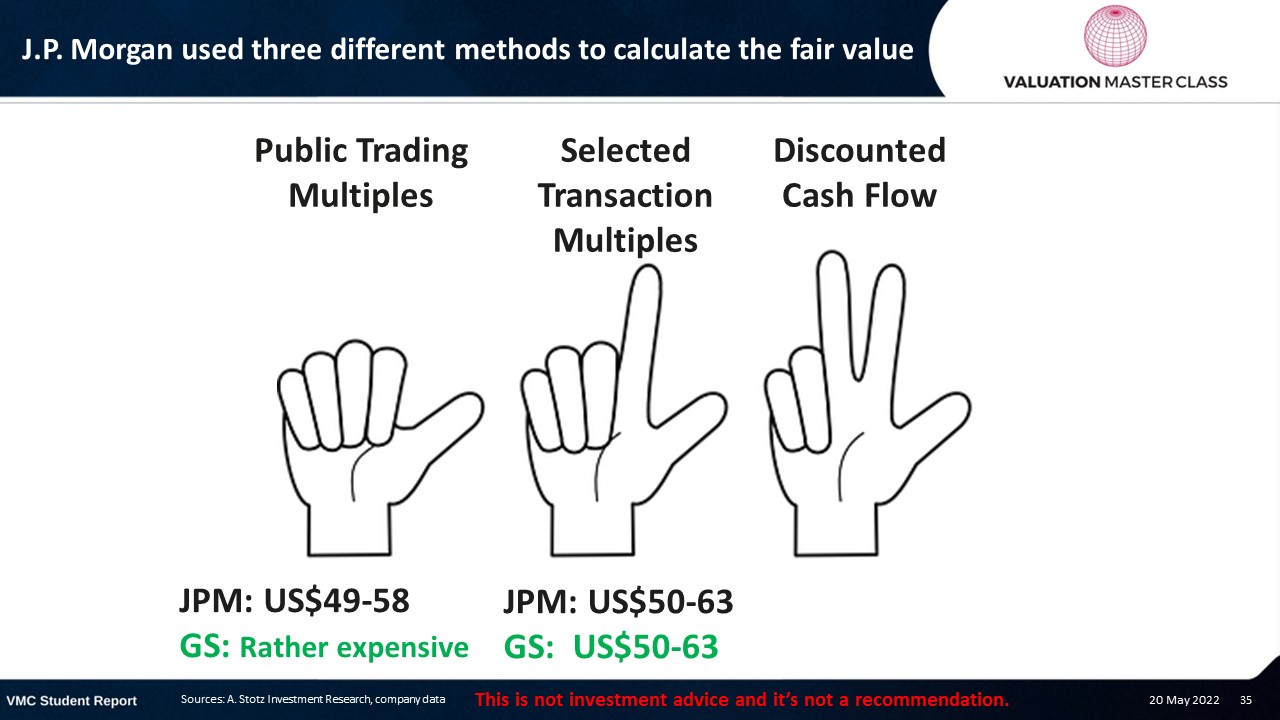
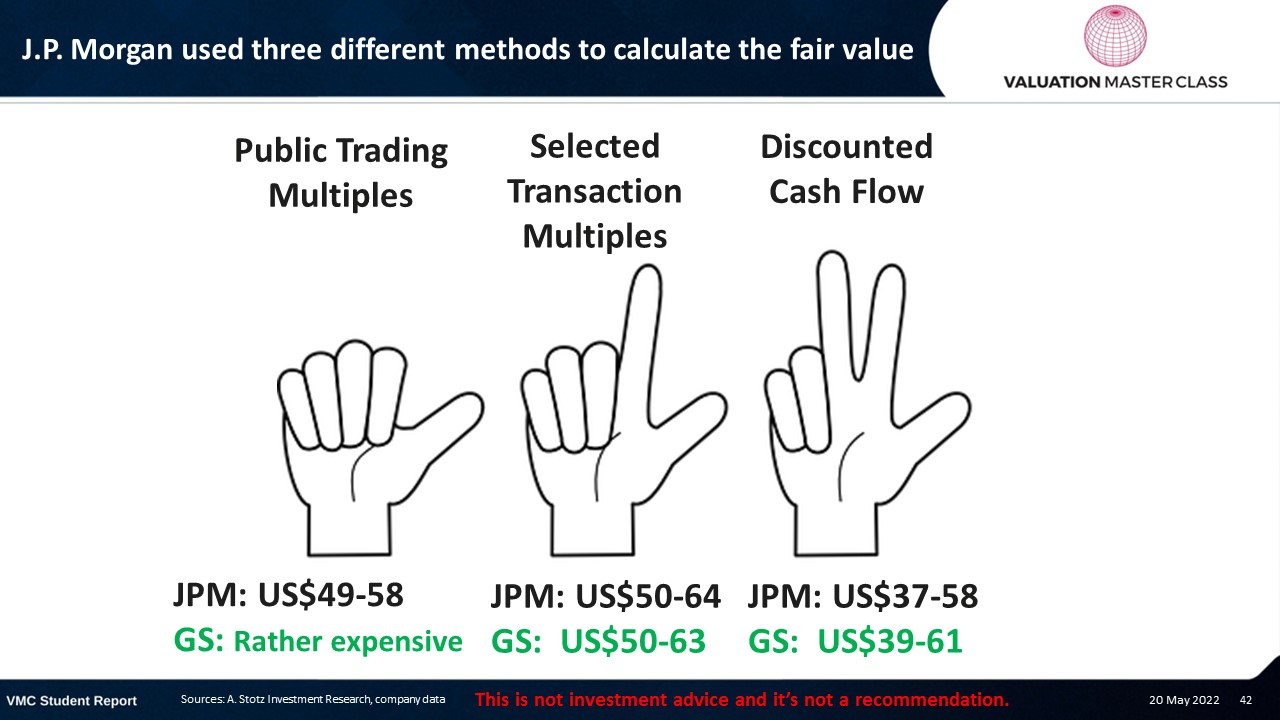
J.P. Morgan used three different methods to calculate the fair value
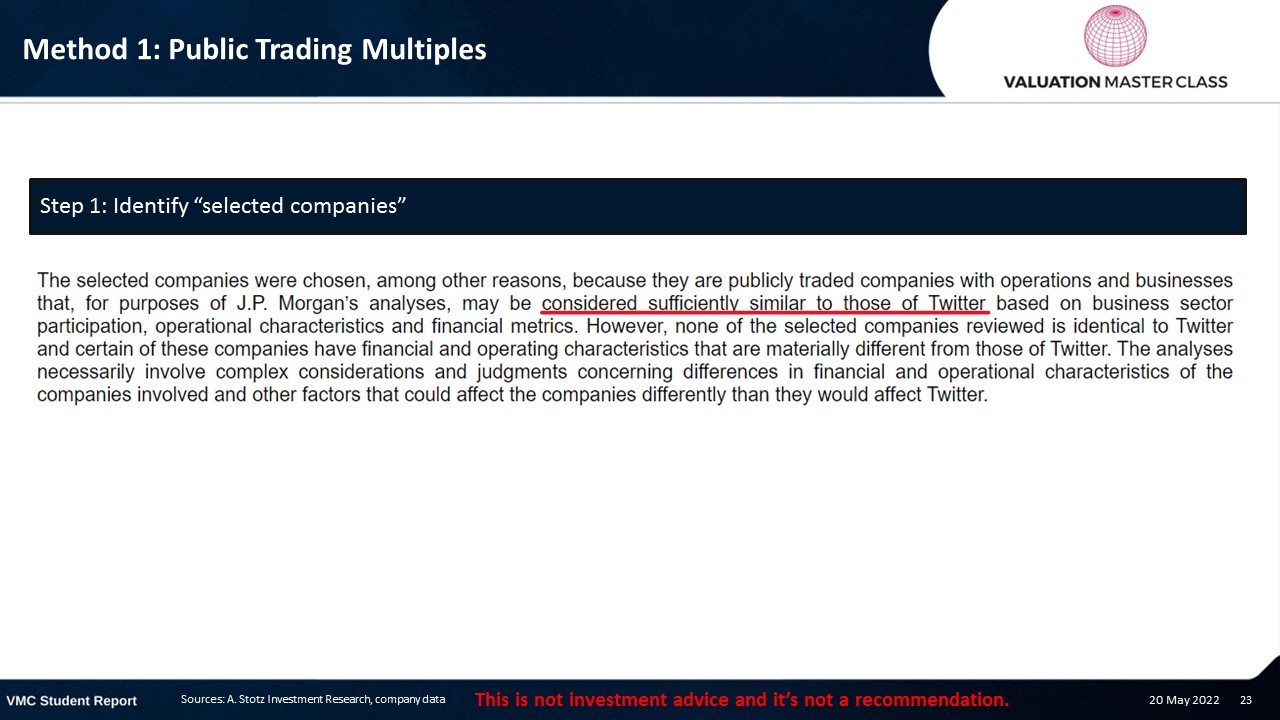
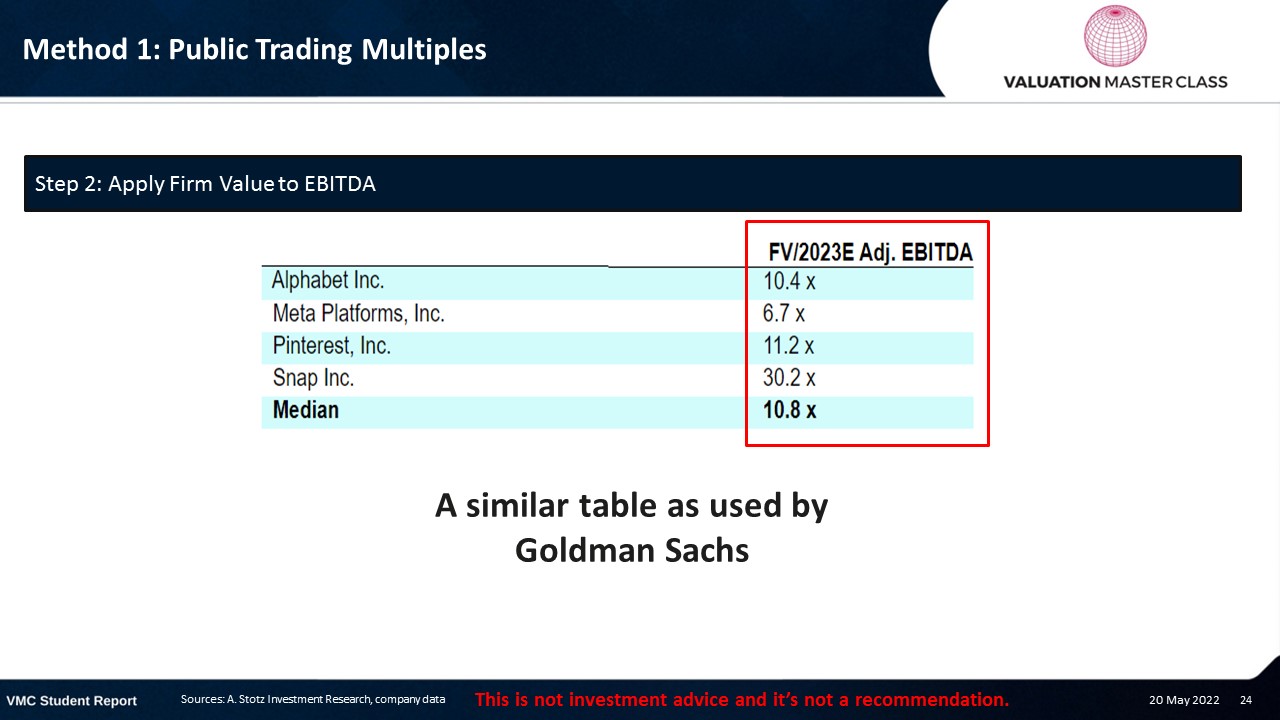
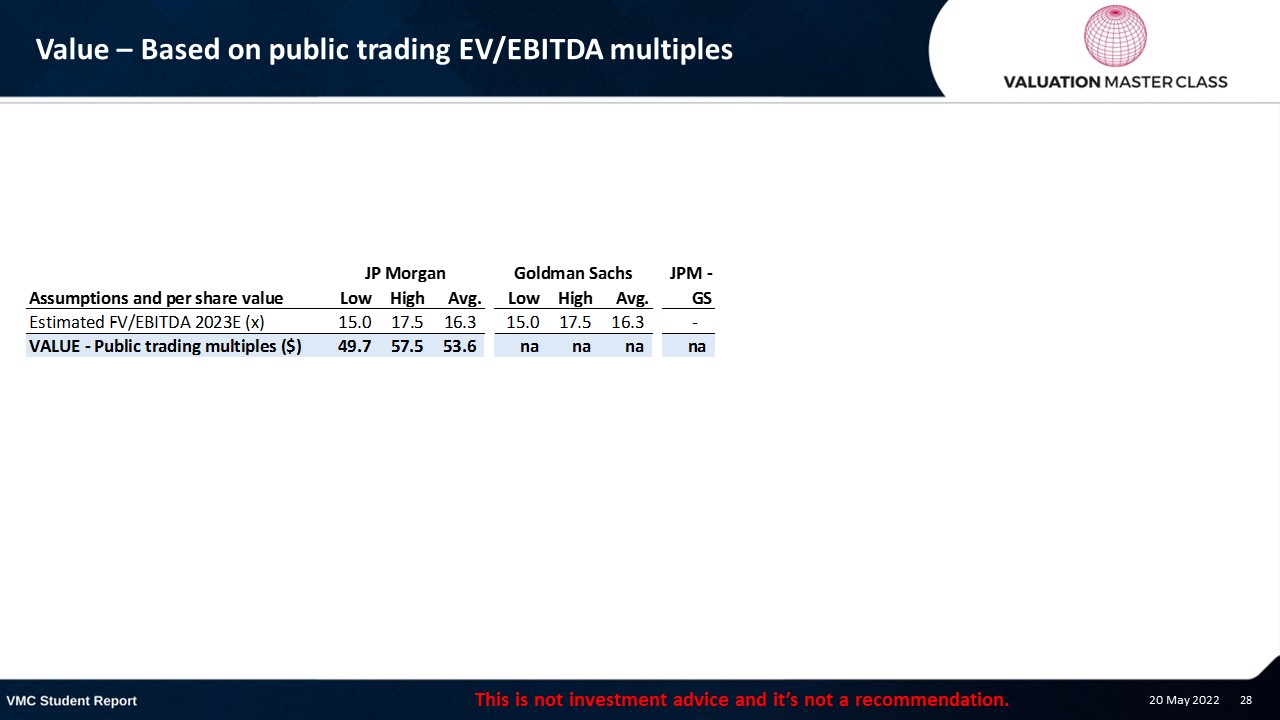
Method 1: Public Trading Multiples
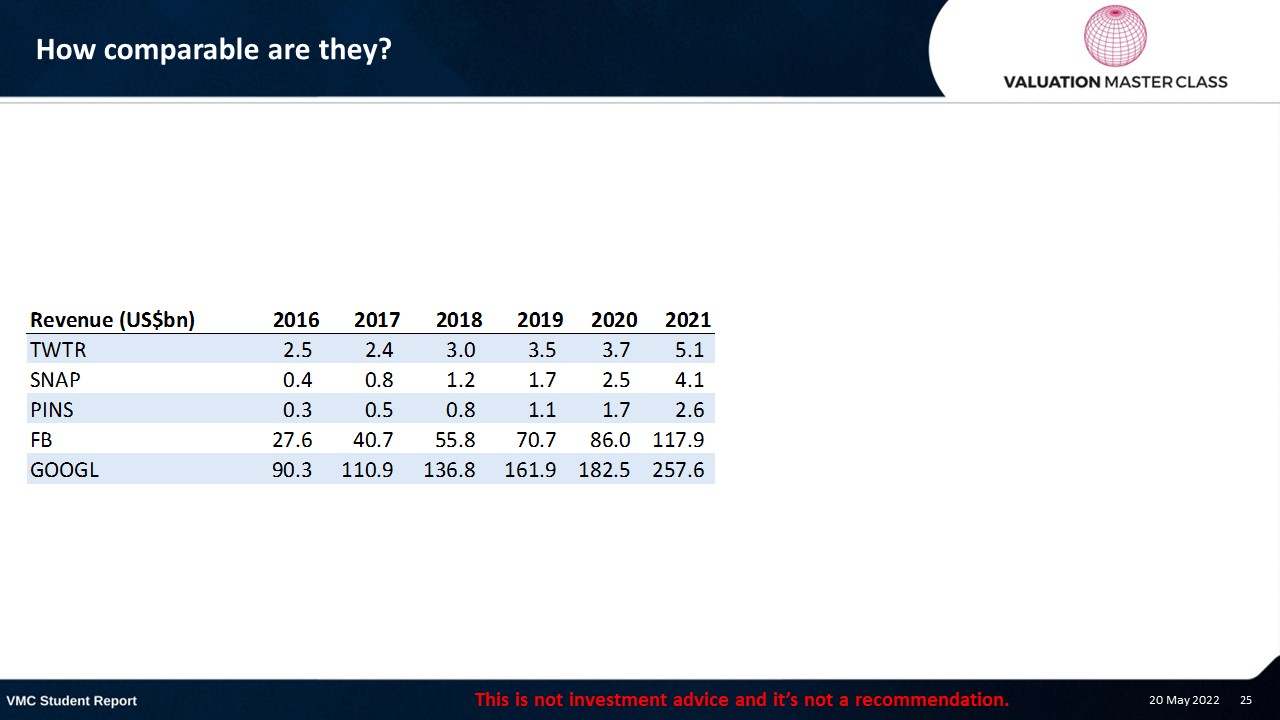
How comparable are they?
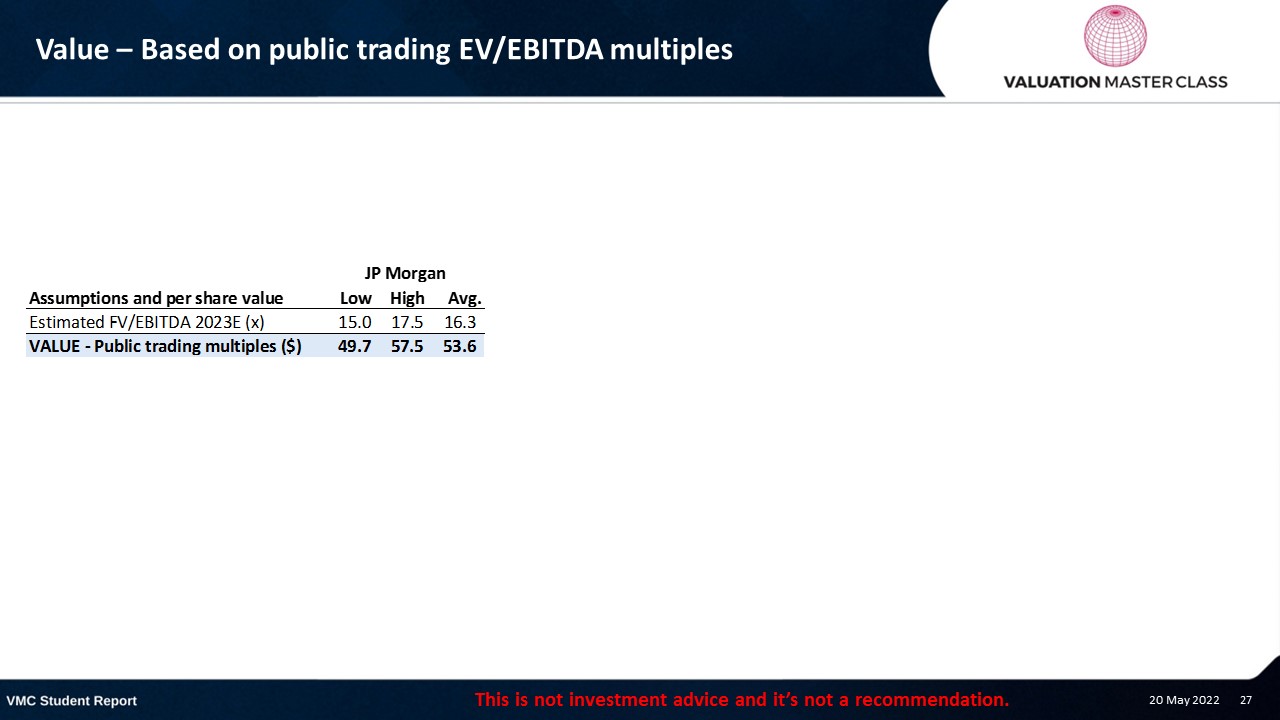
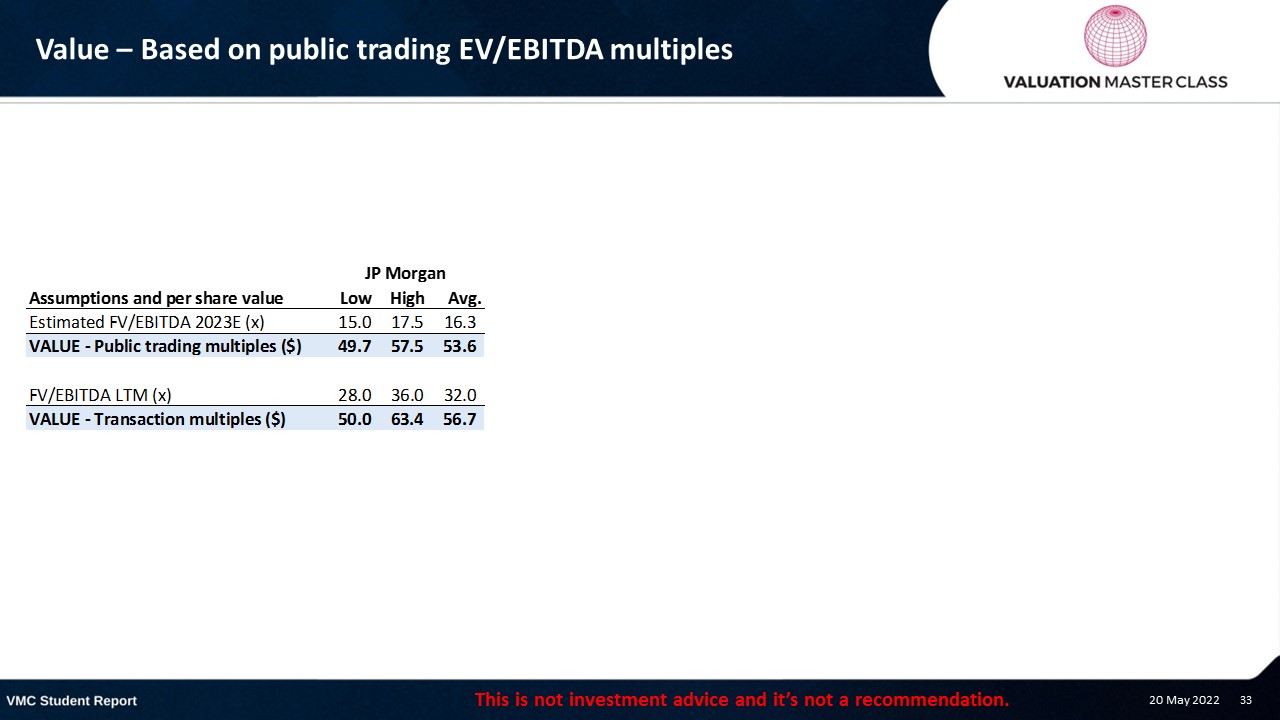
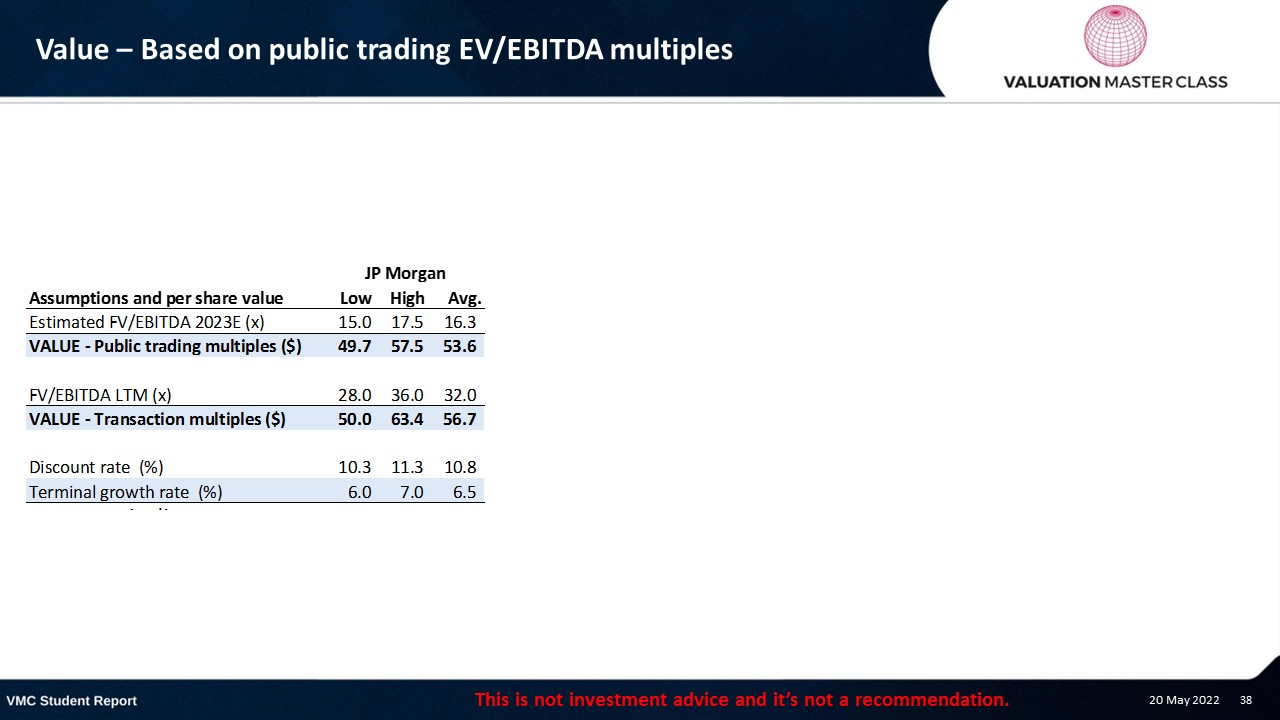
Value – Based on public trading EV/EBITDA multiples
J.P. Morgan used three different methods to calculate the fair value
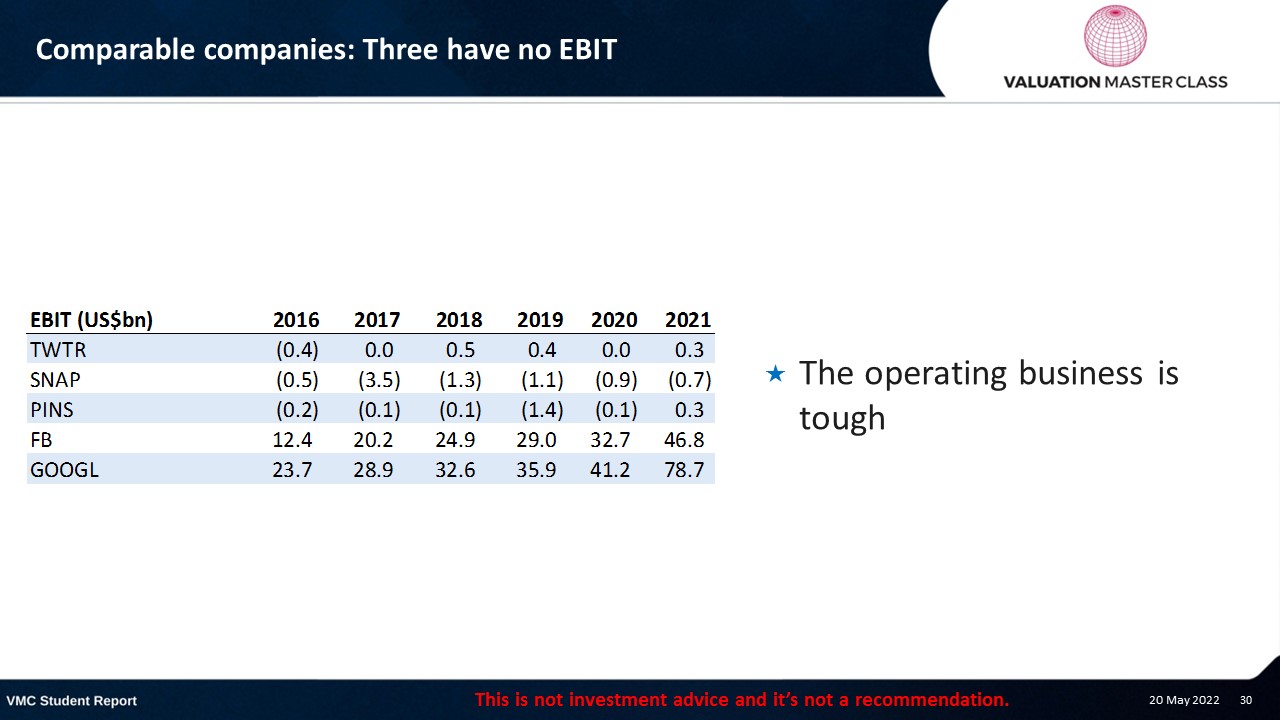
Comparable companies: Three have no EBIT
- The operating business is tough
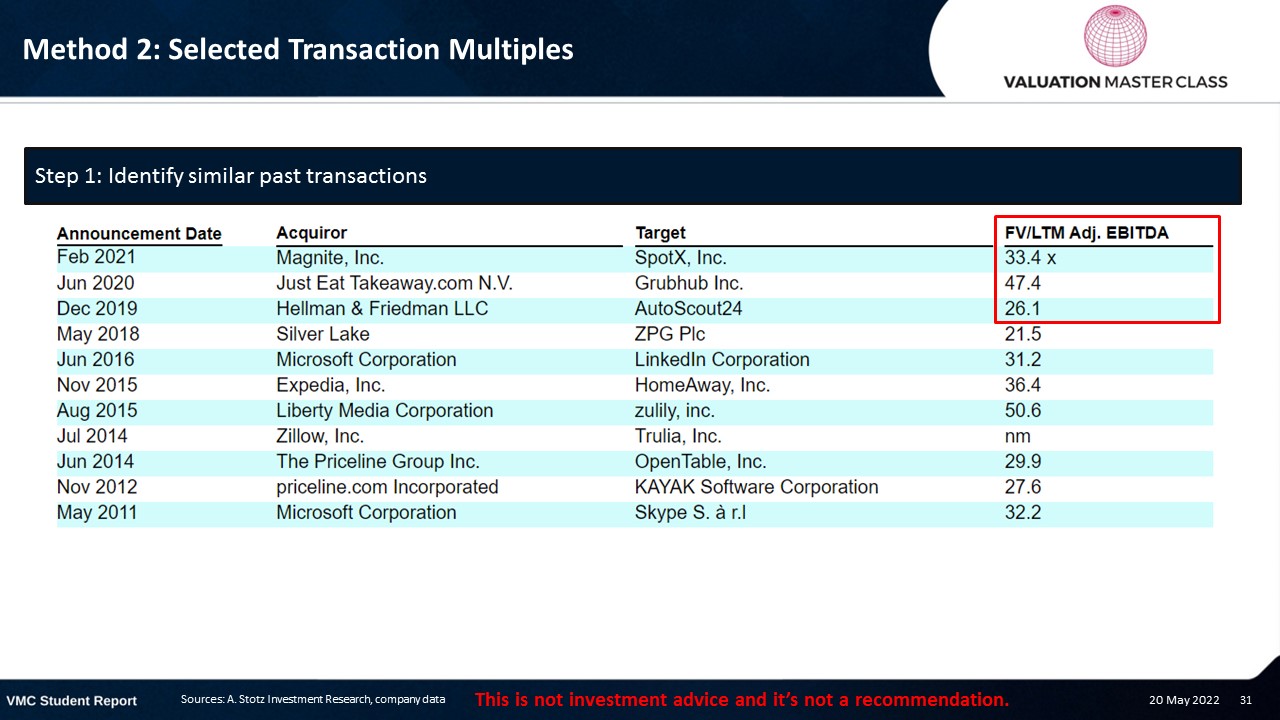
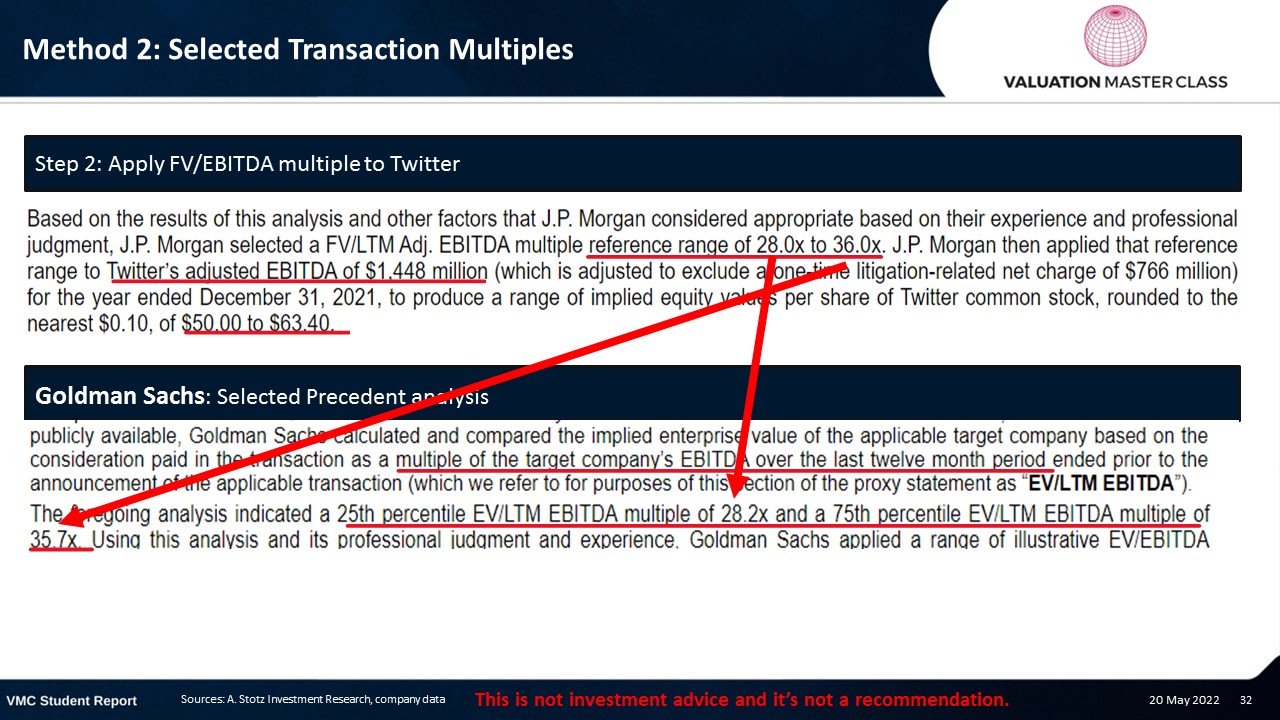
Method 2: Selected Transaction Multiples
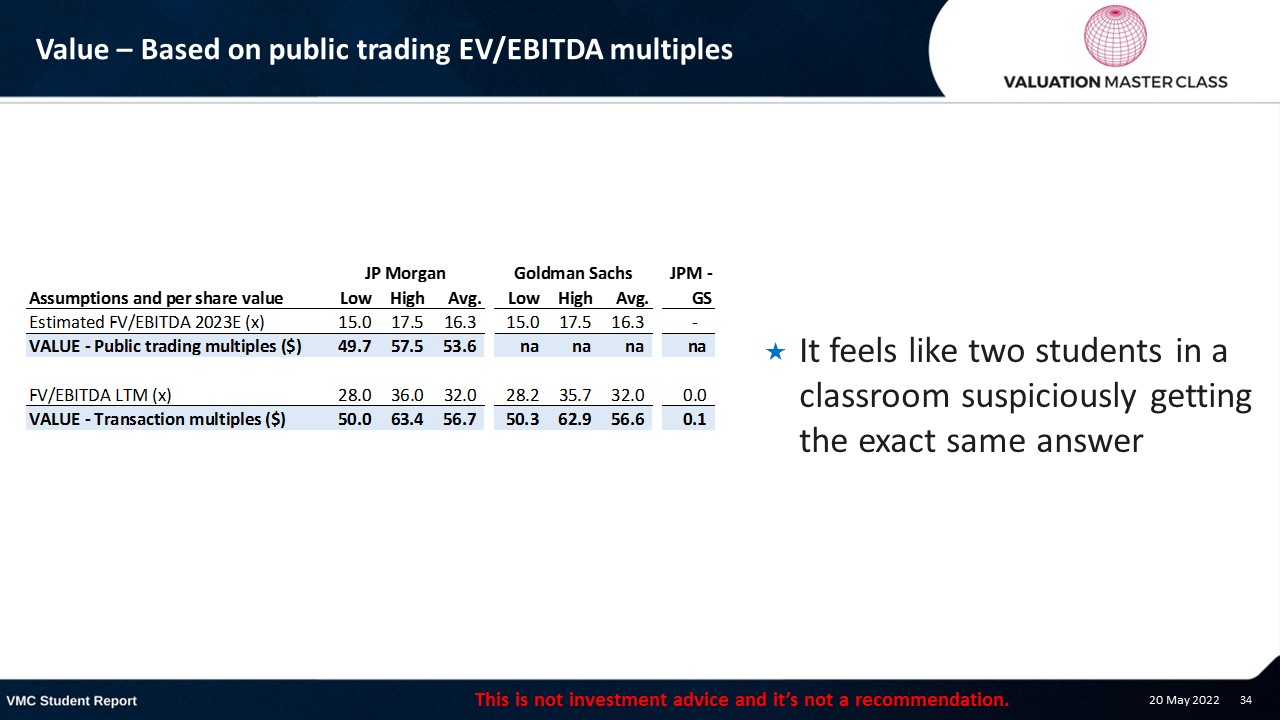
Value – Based on public trading EV/EBITDA multiples
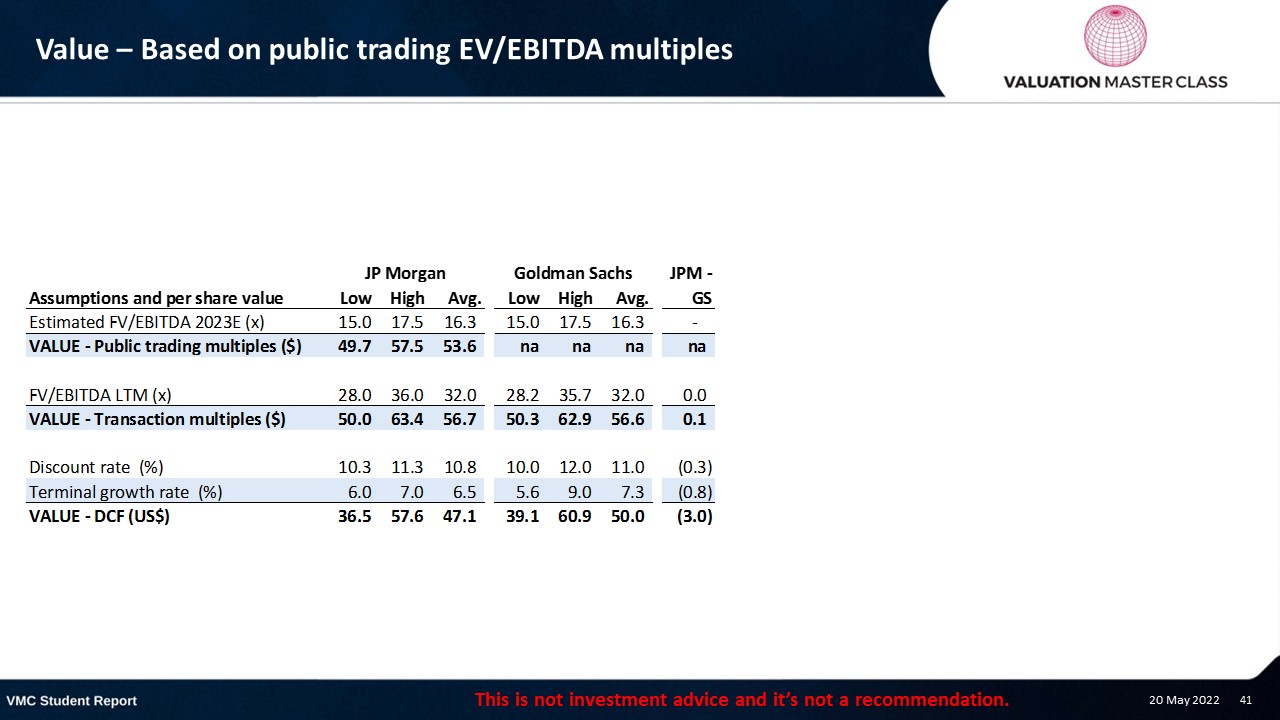
- It feels like two students in a classroom suspiciously getting the exact same answer
J.P. Morgan used three different methods to calculate the fair value
Comparable companies: Three are loss making
- 2018/9 Twitter made money
- 2018 US$0.845bn Inc. tax benefit (Release of valuation allowance from Brazil)
- 2019 Income tax benefit of US$1.2bn – Establishment of deferred tax assets from intra-entity transfer of intangible assets
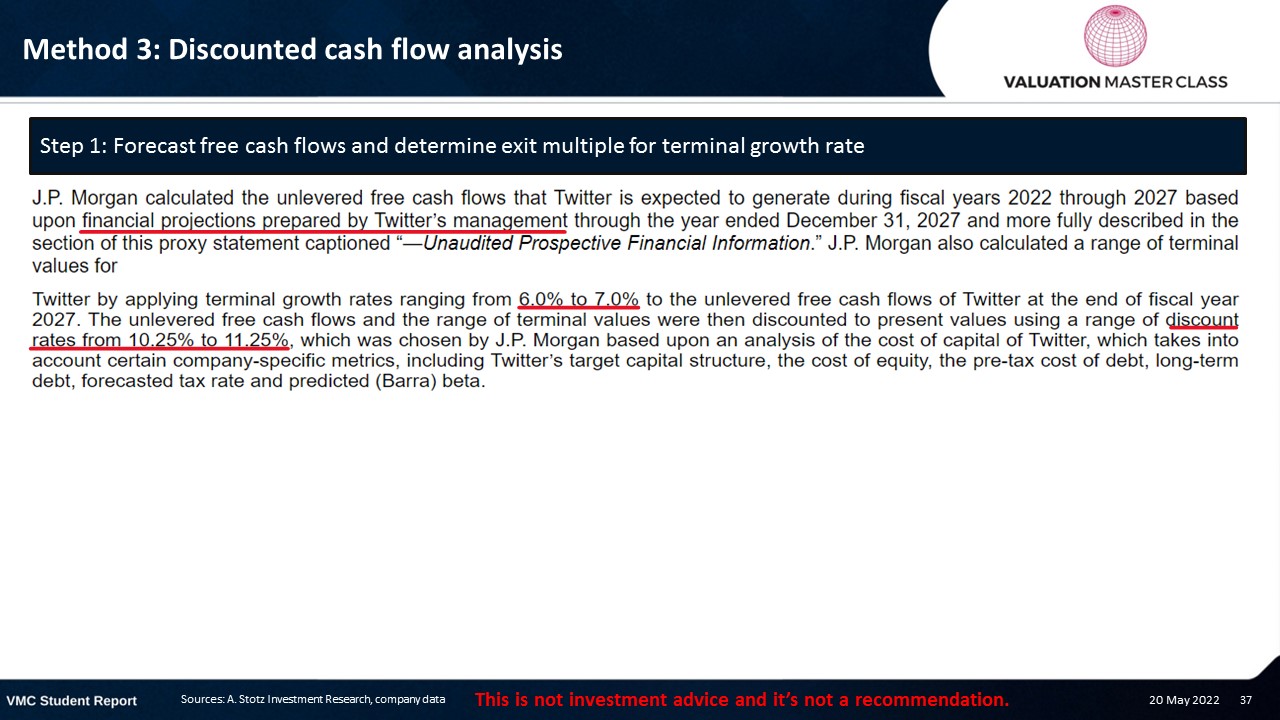
Method 3: Discounted cash flow analysis
Value – Based on public trading EV/EBITDA multiples
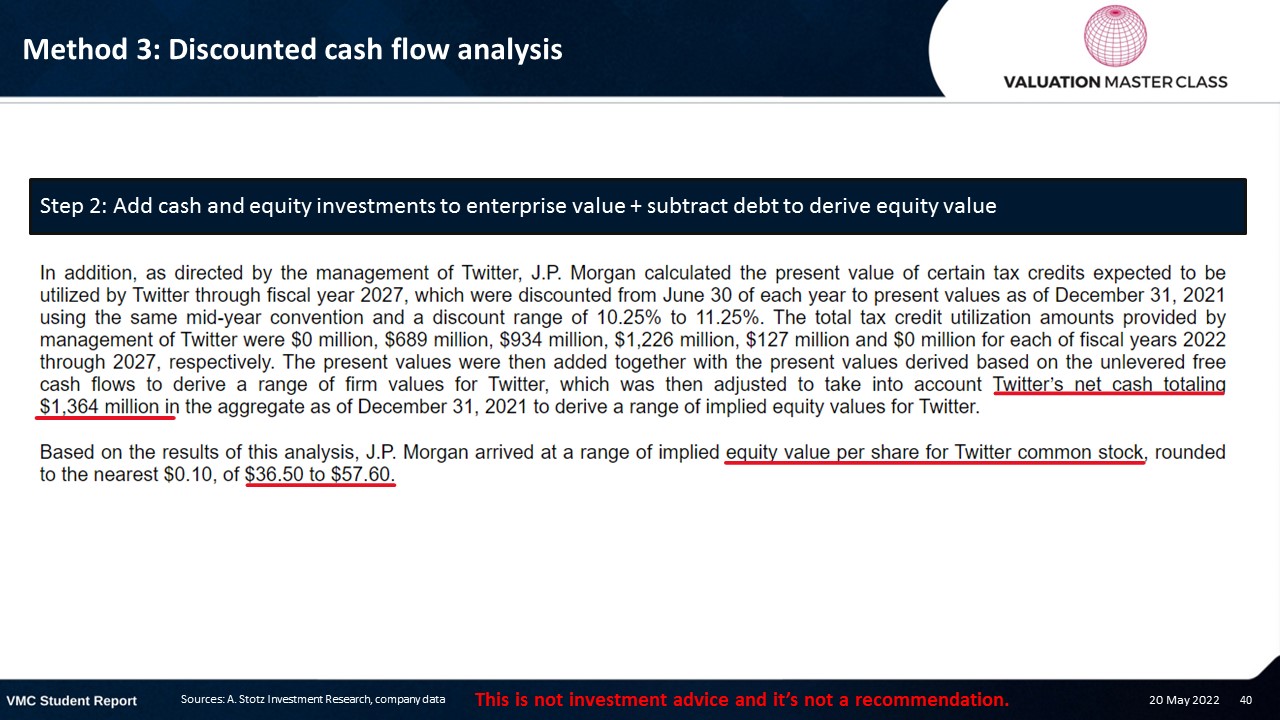
Method 3: Discounted cash flow analysis
Value – Based on public trading EV/EBITDA multiples
J.P. Morgan used three different methods to calculate the fair value
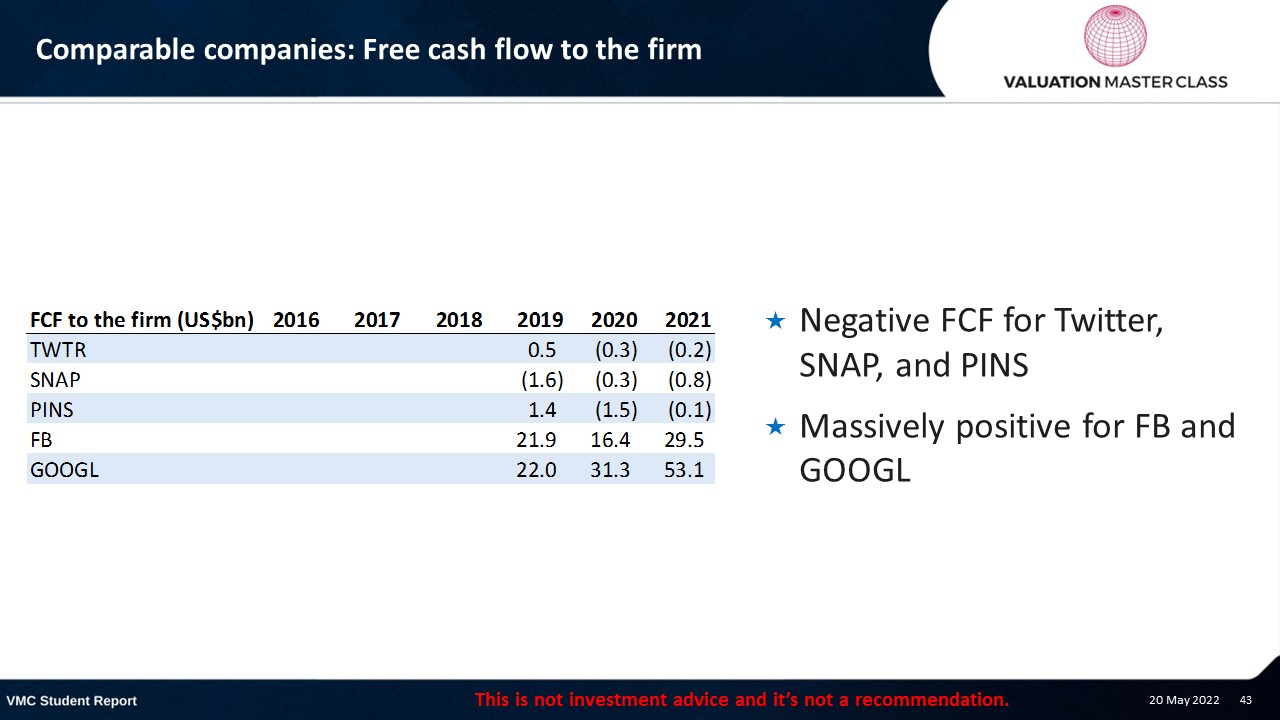
Comparable companies: Free cash flow to the firm
- Negative FCF for Twitter, SNAP, and PINS
- Massively positive for FB and GOOGL
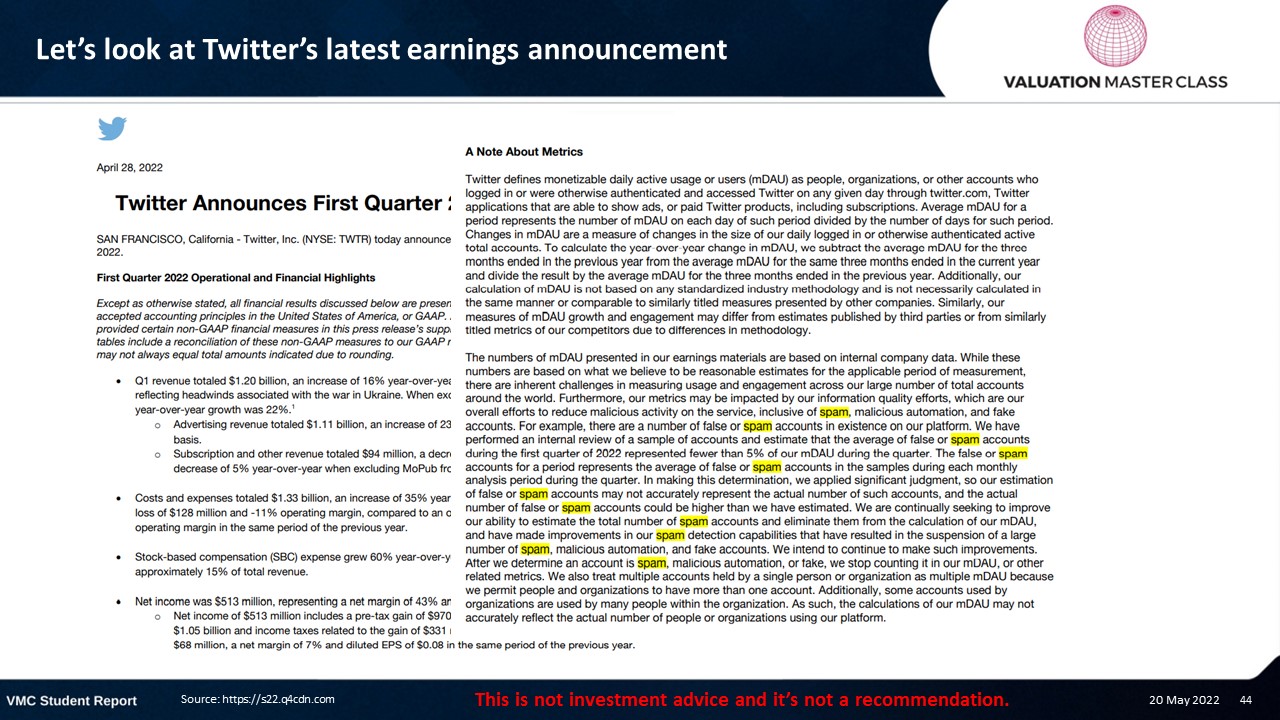
Let’s look at Twitter’s latest earnings announcement
False or spam accounts discussion from 1Q22 release
- “(…) there are a number of false or spam accounts in existence on our platform
- “We have performed an internal review of a sample of accounts and estimate that the average of false or spam accounts during the first quarter of 2022 represented fewer than 5% of our mDAU during the quarter.”
- “In making this determination, we applied significant judgment, so our estimation of false or spam accounts may not accurately represent the actual number of such accounts, and the actual number of false or spam accounts could be higher than we have estimated.”
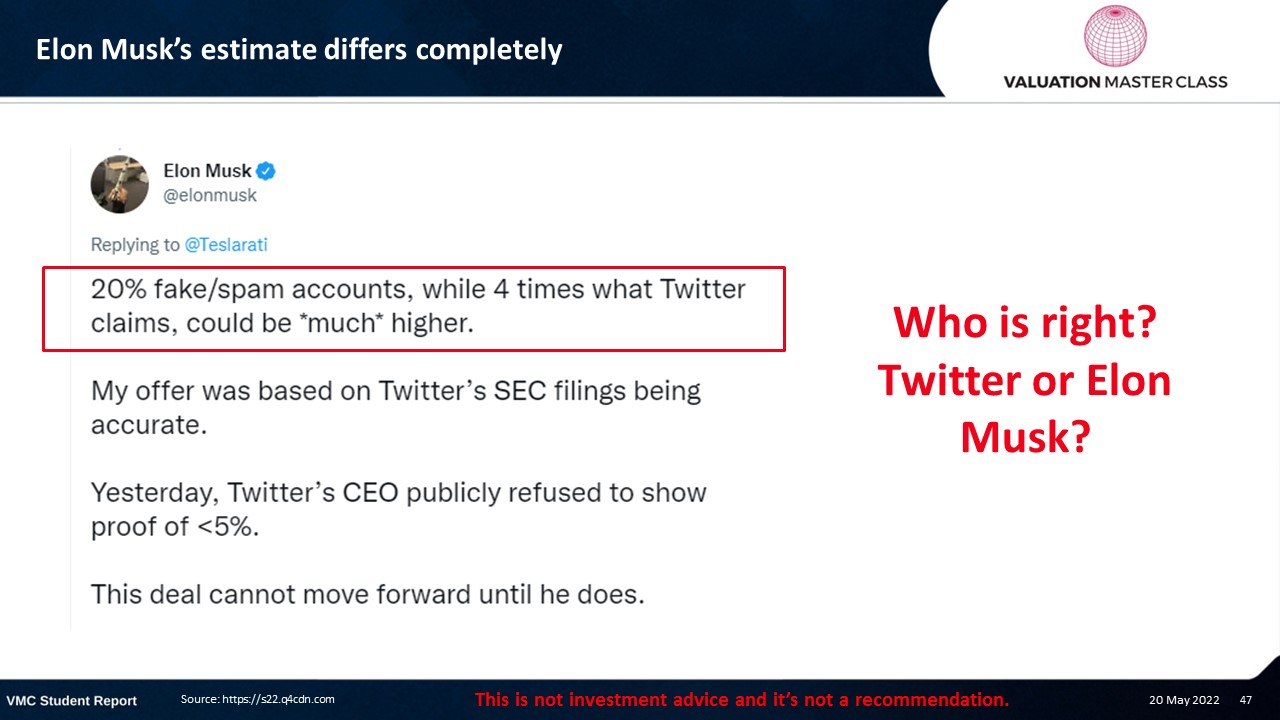
Elon Musk’s estimate differs completely
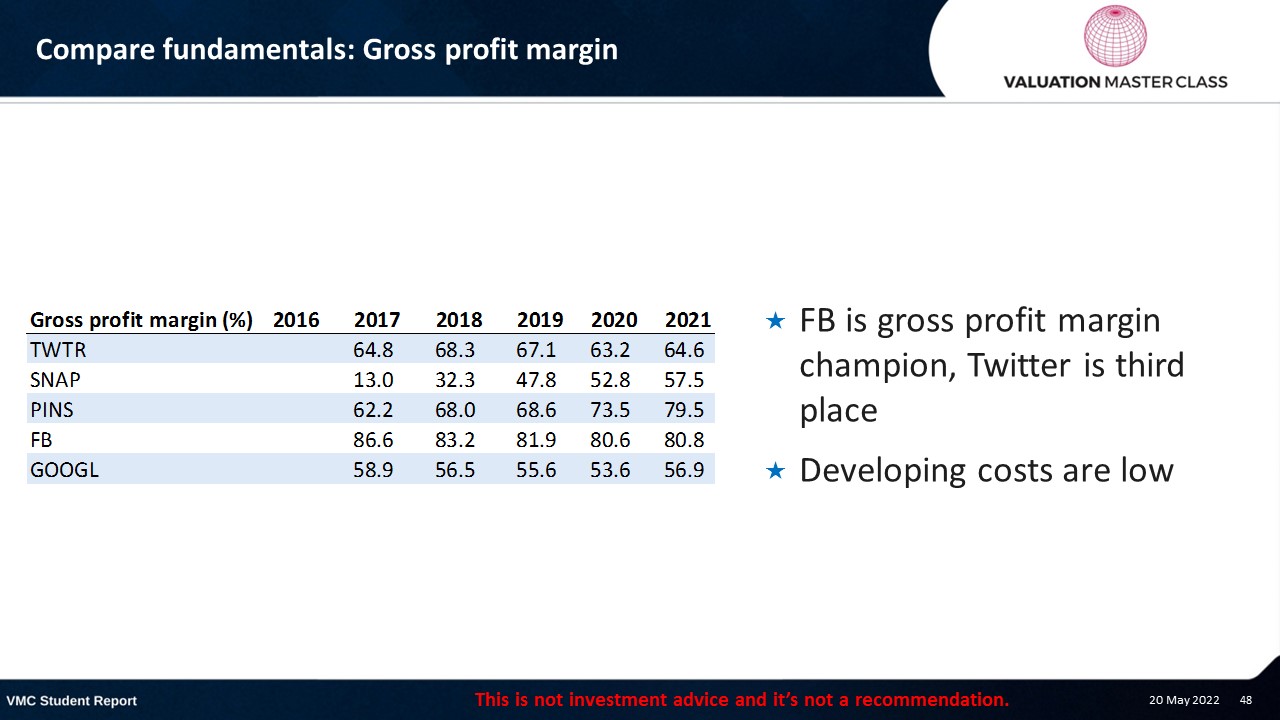
Compare fundamentals: Gross profit margin
- FB is gross profit margin champion, Twitter is third place
- Developing costs are low
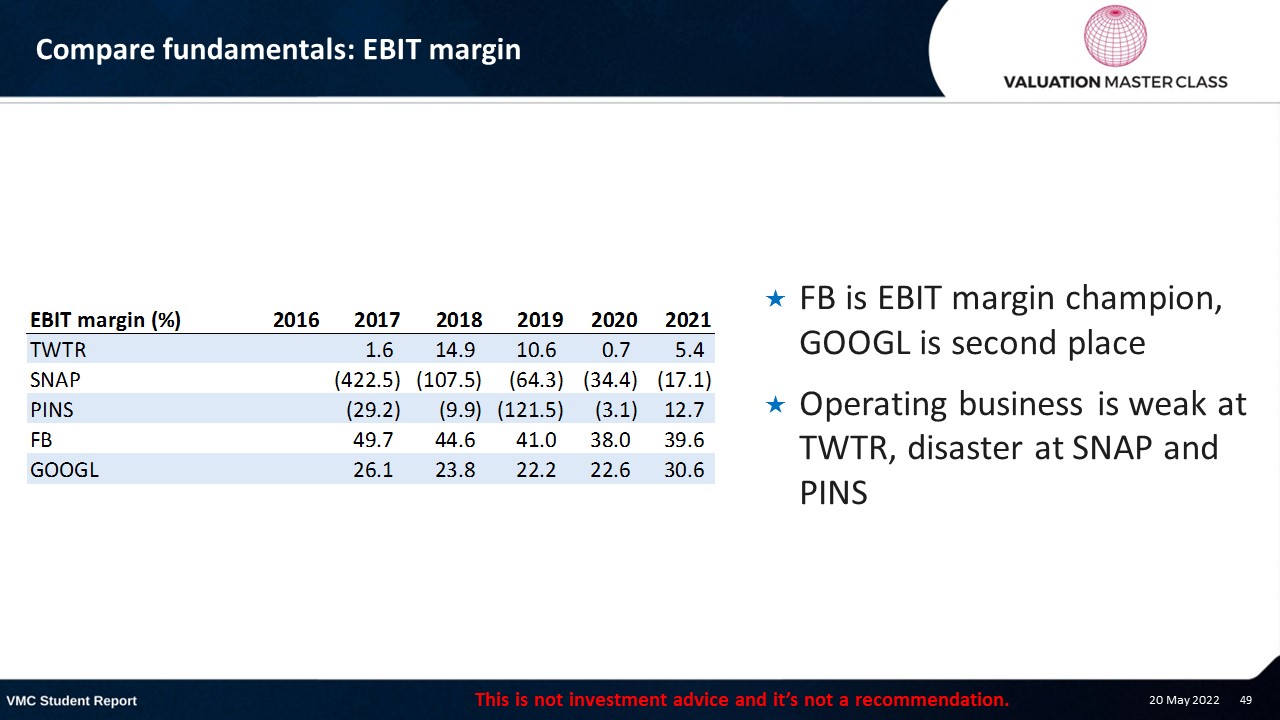
Compare fundamentals: EBIT margin
- FB is EBIT margin champion, GOOGL is second place
- Operating business is weak at TWTR, disaster at SNAP and PINS
Compare fundamentals: Net margin
- SNAP has never made a profit, Twitter only in 2018 and 2019 because of tax adjustments
- FB and GOOGL are killing it
Compare fundamentals: Free cash flow to the firm
- SNAP is bleeding
- Twitter’s return to investors has been tiny
- FB and GOOGL are massive value generators
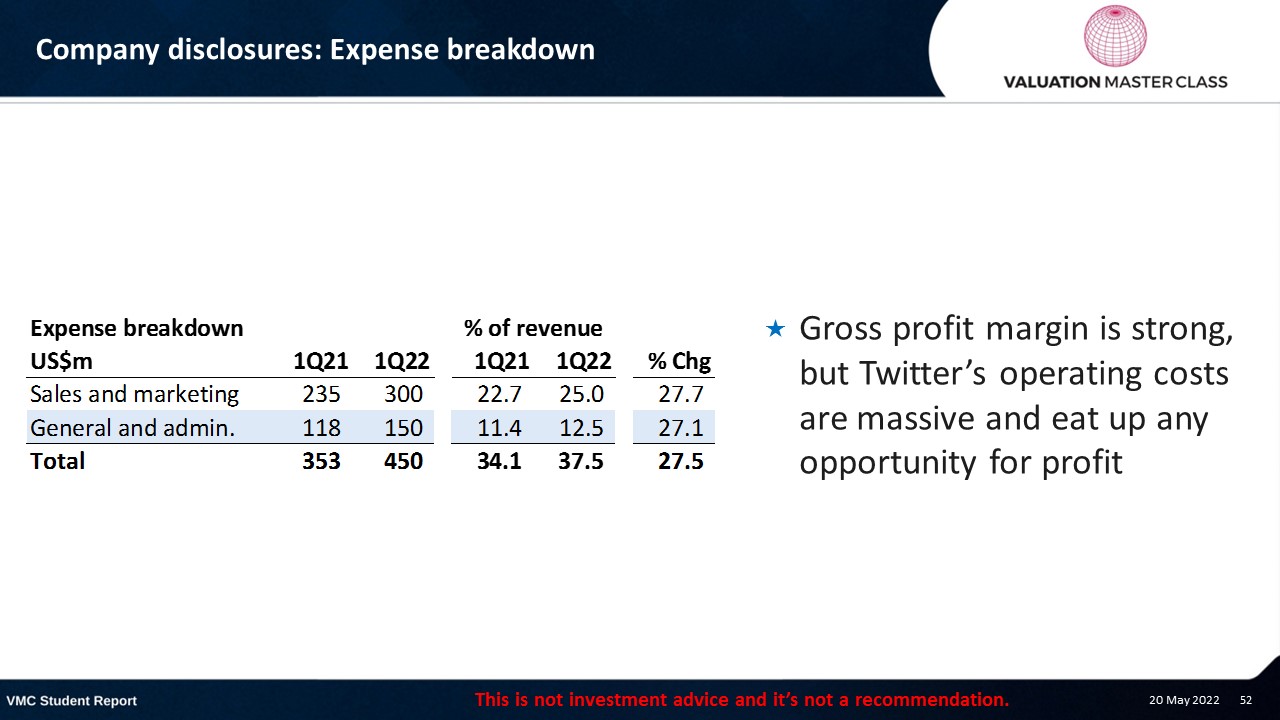
Company disclosures: Expense breakdown
- Gross profit margin is strong, but Twitter’s operating costs are massive and eat up any opportunity for profit
Download the full report as a PDF
DISCLAIMER: This content is for information purposes only. It is not intended to be investment advice. Readers should not consider statements made by the author(s) as formal recommendations and should consult their financial advisor before making any investment decisions. While the information provided is believed to be accurate, it may include errors or inaccuracies. The author(s) cannot be held liable for any actions taken as a result of reading this article.

