Financial Statement Analysis: The Complete Guide
Financial statement analysis is the process of reading, interpreting, and comparing a company’s financial reports to assess its profitability, liquidity, efficiency, and financial health. It is the foundational skill of equity research, investment banking, credit analysis, and corporate finance because every valuation, model, or investment thesis starts with understanding what the numbers actually say.
A company’s financial statements tell a story. The income statement shows what the company earned. The balance sheet shows what it owns and owes. The cash flow statement shows where the cash actually went. Financial statement analysis is the discipline of connecting these three statements, identifying what the numbers reveal about competitive position, capital efficiency, and risk, and knowing when the numbers are misleading.
This guide is the hub for financial statement analysis at Valuation Master Class. Each section covers a core component of the discipline, with links to deeper guides and real company examples.
Starting your finance career?
Our Starter Program gives you the financial analysis and valuation skills to land your first analyst role, including ratio analysis, financial modeling, and interview prep.
The Three Core Financial Statements
Every financial statement analysis begins with the same three documents. Understanding what each one measures and how they connect is non-negotiable before any ratio or metric makes sense.
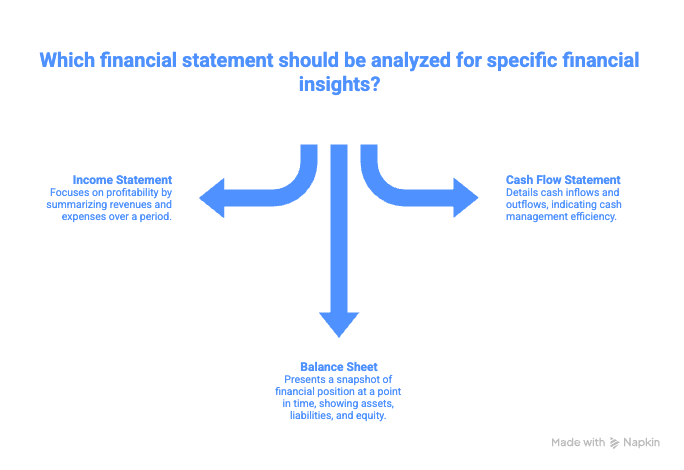
Income Statement
The income statement reports a company’s revenues, costs, and profits over a specific period. It answers the question: how much did the company earn? Key lines to analyze:
- Revenue: Top-line growth rate and quality of earnings
- Gross profit and gross margin: Pricing power and cost of goods structure
- EBIT (Earnings Before Interest and Tax): Operating profitability before financing decisions
- Net income: Bottom-line profit after all costs, interest, and tax
The income statement is where profitability analysis lives. But it can be manipulated through accounting choices, which is why cash flow analysis is always a necessary cross-check.
Balance Sheet
The balance sheet is a snapshot of what a company owns (assets) and what it owes (liabilities) at a specific point in time. The difference between assets and liabilities is shareholders’ equity. Key areas to analyze:
- Current assets vs. current liabilities: Liquidity and short-term solvency
- Total debt and financial leverage: Risk and capital structure
- Invested capital: The base on which returns are measured
- Asset quality: Are assets productive or aging?
The balance sheet connects to the income statement through return metrics (how much income is generated per dollar of assets) and to the cash flow statement through working capital changes.
Cash Flow Statement
The cash flow statement shows actual cash movements, separating operating cash generation from investment spending and financing activity. A company can report high net income while consuming cash. The cash flow statement reveals the truth.
- Operating cash flow: Cash generated from core business operations
- Free cash flow: Operating cash flow minus capital expenditures; the cash available to investors
- Capex: Investment in fixed assets; cross-reference with capex vs. depreciation to assess capital intensity
Profitability Analysis
Profitability ratios measure how efficiently a company converts revenue into profit and how effectively it uses its asset base to generate returns.
EBIT Margin
- EBIT margin measures operating profit as a percentage of revenue, stripping out the effects of interest and tax to show the underlying operating economics of the business.
EBIT Margin = EBIT / Revenue × 100
- EBIT margin is the most comparable profitability metric across companies because it is not affected by capital structure (debt levels) or tax jurisdictions. A company with a 20% EBIT margin generates $0.20 of operating profit for every dollar of revenue.
- Global data shows average net profit margins of around 5.5%, which means analysts who project 15–20% margins for ordinary businesses are almost certainly wrong.
EBIT Return on Assets (EBIT/Assets)
- EBIT return on assets measures how much operating profit the company generates relative to its total asset base. Unlike standard ROA (which uses net income), EBIT/Assets strips out financing effects and provides a purer measure of asset productivity.
EBIT/Assets = EBIT / Total Assets × 100
- This metric is particularly useful for comparing asset-heavy businesses, manufacturers, retailers, and utilities, where the size of the asset base relative to earnings reveals capital efficiency.
Asset Turnover Ratio
- The asset turnover ratio measures how efficiently a company uses its assets to generate revenue.
Asset Turnover = Revenue / Total Assets
- A ratio of 1.5 means the company generates $1.50 of revenue for every $1.00 of assets. Higher is generally better, but the right benchmark is industry-specific.
- Retailers typically have high asset turnover; capital-intensive manufacturers run lower. Comparing a company’s asset turnover to its peers reveals whether it is sweating its assets or sitting on underutilized capacity.
Liquidity Analysis
Liquidity ratios measure a company’s ability to meet its short-term obligations. A company can be profitable and insolvent at the same time if it cannot convert assets to cash fast enough.
Current Ratio
Current Ratio = Current Assets / Current Liabilities
- A current ratio above 1.0 means the company has more short-term assets than short-term liabilities. Below 1.0 signals potential liquidity stress. However, a high current ratio can also mean excess cash sitting idle or slow-moving inventory; context matters.
Quick Ratio
- The quick ratio tightens the liquidity test by excluding inventory (which may not be easily converted to cash):
Quick Ratio = (Cash + Short-term Investments + Receivables) / Current Liabilities
- For businesses with slow-moving or perishable inventory, the quick ratio is a more reliable short-term solvency signal than the current ratio.
Cash Conversion Cycle
- The cash conversion cycle (CCC) measures how long it takes a company to convert its investments in inventory and other resources into cash from sales:
CCC = Days Inventory Outstanding + Days Sales Outstanding − Days Payable Outstanding
- A shorter CCC means the company generates cash faster. Negative CCC, where the company collects cash before it pays suppliers, is a hallmark of operationally excellent businesses like Amazon and Walmart.
- The CCC connects directly to all three working capital metrics covered below.
Efficiency Analysis: Working Capital Ratios
Working capital efficiency determines how much cash a company ties up in day-to-day operations. Three ratios measure the components of the cash conversion cycle.
Receivables Collection Period (Days Sales Outstanding)
- The receivables collection period measures how many days it takes a company to collect payment after making a sale.
DSO = (Accounts Receivable / Revenue) × 365
- A rising DSO means customers are taking longer to pay, which tightens cash flow even if sales are growing. A falling DSO signals faster cash collection and better working capital management.
- Comparing DSO to industry peers reveals whether a company’s credit terms are competitive or a sign of commercial weakness.
Inventory Conversion Period (Days Inventory Outstanding)
- The inventory conversion period measures how many days’ inventory sits before being sold.
DIO = (Inventory / Cost of Goods Sold) × 365
- High DIO means capital is tied up in unsold goods, a risk of obsolescence or demand weakness. Low DIO indicates fast-moving inventory and efficient supply chain management.
- For retailers and manufacturers, DIO is one of the most revealing operational metrics.
Payables Deferral Period (Days Payable Outstanding)
- The payables deferral period measures how long a company takes to pay its suppliers.
DPO = (Accounts Payable / Cost of Goods Sold) × 365
- A longer DPO is generally favorable if the company is using supplier credit as a source of free financing. But excessively long DPO can damage supplier relationships or signal cash flow stress.
- Strong companies with pricing power (like large retailers) naturally command long payable periods.
Together, DSO, DIO, and DPO form the complete inventory, receivables, and payables picture that drives the cash conversion cycle.
Leverage Analysis
Leverage ratios measure the degree to which a company finances its operations with debt versus equity, and the associated financial risk.
Liabilities to Assets Ratio
- The liabilities to assets ratio measures what proportion of a company’s assets are financed by liabilities (debt and other obligations).
Liabilities to Assets = Total Liabilities / Total Assets
- A ratio of 0.6 means 60% of the company’s assets are financed by creditors. Higher ratios indicate greater financial leverage and risk, especially in rising interest rate environments.
- The ratio is most meaningful when compared to industry norms, since capital-intensive sectors (utilities, real estate) routinely carry high leverage that would be alarming in a technology company.
How to Analyze Financial Statements: A Step-by-Step Approach
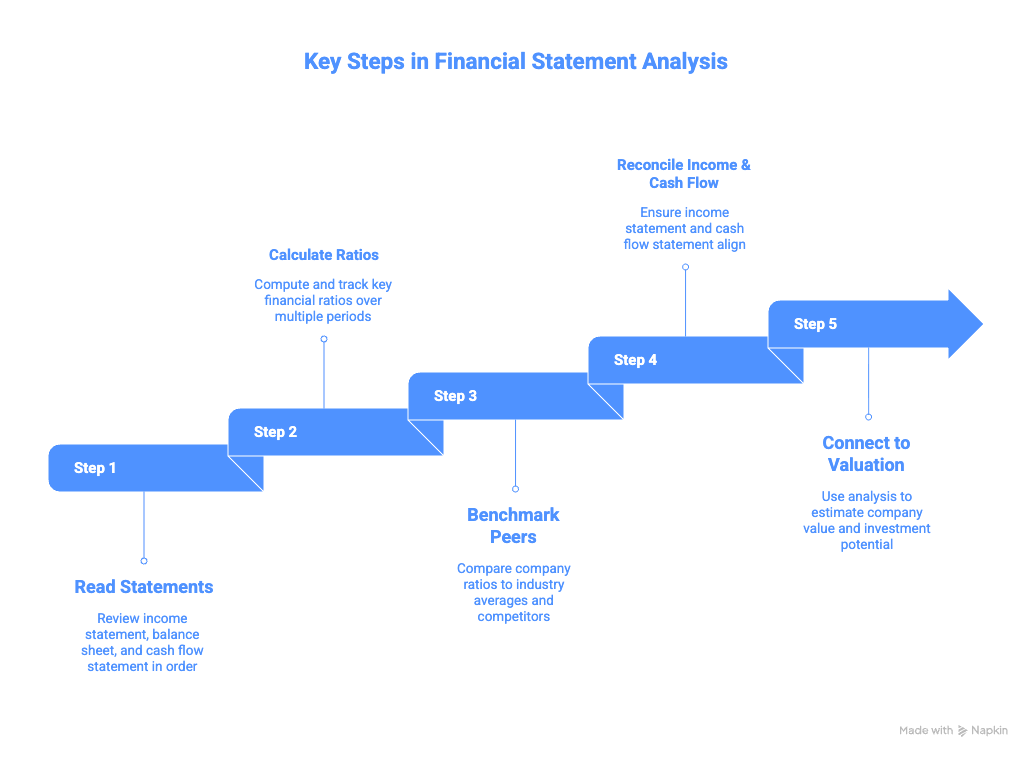
Step 1: Read the Statements in the Right Order
Start with the income statement to understand revenue trends and profitability. Move to the balance sheet to assess asset quality and financial structure. Finish with the cash flow statement to verify that reported profits are backed by actual cash generation.
Step 2: Calculate and Trend Key Ratios Over Time
A single year’s ratio is rarely meaningful. Calculate ratios for 3–5 years and look for trends. A declining EBIT margin over three years tells a more important story than a single year’s number.
Step 3: Benchmark Against Peers
Compare ratios to industry competitors. A 15% EBIT margin is exceptional for a retailer but mediocre for a software company. Benchmarks require understanding the business model, not just the number.
Step 4: Reconcile Income and Cash Flow
Check whether operating cash flow tracks net income. Persistent divergence where net income grows, but operating cash flow does not, is a red flag for aggressive revenue recognition or expense capitalization.
Step 5: Connect to Valuation
Financial statement analysis feeds directly into valuation. Profitability ratios inform margin assumptions in DCF models. Working capital ratios drive cash flow projections. Leverage ratios determine capital structure and WACC inputs. The DCF valuation is only as reliable as the financial statement analysis behind it.
Ready to advance?
The Advancer Program helps mid-career professionals sharpen their analytical skills and stand out for promotions or moves into equity research and investment roles.
Financial Statement Analysis vs. Financial Modeling
Financial statement analysis and financial modeling are sequential disciplines; analysis comes first, modeling comes second.
| Financial Statement Analysis | Financial Modeling | |
|---|---|---|
| Focus | Historical performance and current position | Future projections |
| Key skill | Ratio interpretation and trend identification | Assumption-setting and statement linkage |
| Output | Diagnosis — what is this company? | Forecast — what will this company become? |
| Tools | Ratios, benchmarks, trend analysis | 3-statement models, DCF, scenario analysis |
| Feeds into | Financial models and valuation | Investment decisions and recommendations |
You cannot build a reliable financial model without first understanding the historical financial statements. Garbage-in assumptions based on misread financials produce garbage-out models. FSA is the foundation; modeling is the structure built on top.
Common Mistakes in Financial Statement Analysis
- Ignoring cash flow: Net income can be inflated through accounting choices. Always verify that income is supported by operating cash flow. A company growing profits while burning cash is a warning sign.
- Using ratios without industry context: A current ratio of 0.8 might signal distress for a manufacturer, but is entirely normal for a subscription software company with deferred revenue. Every ratio requires a benchmark.
- Analyzing a single year: One year of data is rarely meaningful. Look for trends over 3–5 years. Is the EBIT margin expanding or contracting? Is DSO rising? Trends reveal more than snapshots.
- Confusing revenue growth with value creation: A company can grow revenue rapidly while destroying value if returns on invested capital fall below the cost of capital. Always pair growth metrics with return on invested capital analysis.
- Missing off-balance-sheet obligations: Operating leases, pension obligations, and contingent liabilities may not appear prominently on the balance sheet but represent real financial commitments. Read the footnotes.
Data Sources for Financial Statement Analysis
| Need | Source | Notes |
|---|---|---|
| Company financials | SEC EDGAR | 10-K annual, 10-Q quarterly |
| Industry ratio benchmarks | Damodaran Industry Data | Margins, turnover, leverage by sector |
| Peer comparison | Capital IQ, Bloomberg | Consensus and historical financials |
| Accounting standards | FASB | US GAAP standards |
| International standards | IFRS Foundation | IFRS accounting framework |
| General reference | Investopedia — FSA | Definitions and overview |
| Professional standards | CFA Institute | Financial reporting and analysis curriculum |
Switching into finance from another field?
Our Switcher Program is designed for career changers who need to build credibility fast — no prior finance background required.
Financial Statement Analysis in Practice: Real Company Examples
- PepsiCo vs. Coca-Cola Profit Margin Comparison: A real-world profitability analysis comparing two industry leaders with identical products but very different margin structures.
- Receivables Collection at Consumer Companies: How DSO varies between B2B and B2C businesses, and what a rising receivables period signals about commercial health.
- Liabilities to Assets in Capital-Intensive Industries: Why a 0.7 ratio is normal for a utility but alarming for a retailer, and how to benchmark leverage correctly.
- EBIT Return on Assets Across Sectors: How asset productivity differs between capital-light and capital-heavy businesses, and what it implies for valuation multiples.
- Inventory Conversion Period in Retail and Manufacturing: How fast-fashion retailers and industrial manufacturers differ on DIO and why it matters for free cash flow.
- Cash Conversion Cycle Analysis: How Amazon’s negative CCC funds its own growth, and how to identify companies that generate cash before they spend it.
- Payables Deferral and Supplier Power: How large retailers extend payable periods as a competitive advantage and what happens when that power weakens.
Frequently Asked Questions
What is the most important financial ratio for analysts?
There is no single “most important” ratio; different ratios answer different questions. For profitability, EBIT margin and EBIT/assets are the most comparable across companies. For efficiency, the cash conversion cycle captures working capital management in one number. For value creation, return on invested capital is the most important single metric. A company that grows but earns ROIC below its cost of capital is destroying value regardless of how strong the income statement looks.
What is the cash conversion cycle, and why does it matter?
The cash conversion cycle measures how many days it takes a company to convert its investments in inventory and receivables into cash, calculated as DSO + DIO − DPO. A shorter cycle means faster cash generation. Companies with negative cash conversion cycles (like large retailers) collect cash from customers before paying suppliers, effectively funding operations with free supplier credit. It is one of the most revealing operational efficiency metrics in financial statement analysis.
How does financial statement analysis connect to valuation?
Financial statement analysis feeds directly into every valuation method. Historical profitability ratios anchor margin assumptions in DCF models. Working capital ratios drive cash flow projections. Leverage ratios determine capital structure inputs for WACC. Asset turnover trends inform revenue growth assumptions. A DCF built on misread financial statements will produce a wrong answer, which is why FSA is always the first step before any valuation work begins.
What is the difference between the current ratio and the quick ratio?
Both ratios measure short-term liquidity. The current ratio divides current assets by current liabilities. A ratio above 1.0 suggests the company can cover short-term obligations. The quick ratio excludes inventory from current assets, providing a stricter test of liquidity for businesses where inventory cannot be quickly converted to cash. For retailers or manufacturers with slow-moving stock, the quick ratio is the more conservative and meaningful measure.
Where can I learn financial statement analysis online?
The most effective way to learn financial statement analysis is by applying it to real company filings, not just memorizing formulas. The Valuation Master Class Boot Camp is a financial statement analysis course online that teaches you to read financial statements, calculate and interpret key ratios, and connect the analysis to DCF valuation and equity research using real companies, with expert feedback from Dr. Andrew Stotz, a former #1-ranked equity analyst. Programs are available for career starters, advancers, and career switchers.
Ready to Take the Next Step?
Join 5,000+ finance professionals who’ve leveled up with Valuation Master Class.