Investment Analysis: The Complete Guide
Investment analysis is the process of evaluating financial assets, such as stocks, bonds, and portfolios, to determine their value, risk, and potential return. Professional analysts use it to decide what to buy, hold, or sell, and at what price. Whether you’re building a DCF model, applying the Capital Asset Pricing Model (CAPM), or assessing a company’s equity risk premium, investment analysis is the core skill that drives every decision in equity research, portfolio management, and corporate finance.
This guide covers the methods, frameworks, and ratios used by professional analysts with real examples and step-by-step instructions.
What Is Investment Analysis?
Investment analysis is a structured evaluation of a financial asset or portfolio to determine whether it is worth investing in, at what price, and under what conditions.
It answers three core questions:
- What is this asset worth? (Intrinsic value)
- What is the risk? (Volatility, downside, uncertainty)
- Does the expected return justify the risk? (Risk-adjusted return)
Investment analysis spans multiple asset classes: equities, fixed income, derivatives, and alternatives, but the principles are consistent: collect data, model cash flows, quantify risk, and compare value to price.
Who Uses Investment Analysis?
| Role | Application |
|---|---|
| Equity Research Analyst | Value individual stocks; publish buy/sell recommendations |
| Portfolio Manager | Select assets and construct diversified portfolios |
| Investment Banker | Evaluate acquisition targets and merger pricing |
| Corporate Finance Analyst | Assess capital budgeting decisions and project ROI |
| Private Equity Analyst | Evaluate buyout targets using LBO and DCF models |
Starting your finance career?
Our Starter Program gives you the foundational skills to land your first analyst role — DCF valuation, financial modeling, and interview prep included.
The Three Pillars of Investment Analysis
Professional investment analysis rests on three interconnected disciplines: fundamental analysis, quantitative analysis, and portfolio theory.
1. Fundamental Analysis
Fundamental analysis determines an asset’s intrinsic value by examining the underlying business, its financial statements, competitive position, management quality, and industry dynamics.
The process includes:
- Financial statement analysis: Reading income statements, balance sheets, and cash flow statements to understand profitability, liquidity, and solvency
- DCF valuation: Projects future free cash flows and discounts them to present value
- Comparable company analysis: Benchmarking valuation multiples (P/E, EV/EBITDA) against peers
- Qualitative assessment: Evaluating management quality, competitive moats, and regulatory risk
Fundamental analysis answers: “What is this company truly worth?”
2. Quantitative and Risk Analysis
Quantitative analysis uses mathematical models to measure risk and expected return. Core tools include:
- Capital Asset Pricing Model (CAPM): Estimates the expected return of an asset based on its systematic risk (beta) relative to the market
- Equity Risk Premium (ERP): The excess return investors demand for holding equities over risk-free assets
- Risk-free rate: Typically,
- the yield on 10-year government bonds; the baseline return for all risk calculations
- Arbitrage Pricing Theory (APT): A multi-factor alternative to CAPM that accounts for macroeconomic variables
3. Portfolio Theory
Modern portfolio theory (MPT) frames investment decisions not just at the asset level, but at the portfolio level, optimizing the combination of assets to maximize expected return for a given level of risk.
Key concepts:
- Diversification: Combining assets with low correlation reduces total portfolio risk without sacrificing return
- Efficient frontier: The set of portfolios that offer the highest return for each level of risk
- Sharpe ratio: Measures risk-adjusted return: (Return − Risk-free rate) / Standard deviation
How to Value Stocks: Core Investment Analysis Methods
Discounted Cash Flow (DCF) Valuation
DCF is the foundation of fundamental investment analysis. It calculates the present value of all expected future free cash flows, discounted at the weighted average cost of capital (WACC).
DCF formula:
Intrinsic Value = Σ [FCFt / (1 + WACC)^t] + Terminal Value / (1 + WACC)^n
Where:
- FCFt = Free cash flow in year t
- WACC = Weighted average cost of capital (discount rate)
- Terminal Value = Value of cash flows beyond the forecast period
A full DCF valuation typically projects 5–10 years of cash flows, then applies a terminal value using either the Gordon Growth Model or an exit multiple. Learn more about stock valuation methods that build on DCF.
The Gordon Growth Model
The Gordon Growth Model (GGM) values a stock based on its expected dividends, growing at a constant rate indefinitely:
P = D1 / (r − g)
Where:
- P = Current stock price
- D1 = Expected dividend next year
- r = Required rate of return (from CAPM)
- g = Constant dividend growth rate
GGM is best suited for mature, dividend-paying companies with stable growth (utilities, consumer staples). It is a key input in deriving the equity risk premium.
Relative Valuation (Comparable Company Analysis)
Relative valuation benchmarks a company’s valuation multiples against peers:
| Multiple | Formula | Use Case |
|---|---|---|
| P/E Ratio | Price / EPS | Profitability-focused comparison |
| EV/EBITDA | Enterprise Value / EBITDA | Capital structure-neutral comparison |
| P/B Ratio | Price / Book Value | Financial companies, asset-heavy industries |
| EV/Revenue | Enterprise Value / Revenue | High-growth, pre-profit companies |
The challenge with relative valuation is that it only tells you whether a stock is cheap or expensive relative to peers, not whether the entire sector is over- or undervalued. Combine it with DCF for a more complete picture. See how to value cyclical companies for sector-specific adjustments.
Time Value of Money: The Foundation of All Valuation
Every investment analysis technique traces back to one principle: the time value of money (TVM). A dollar received today is worth more than a dollar received in the future because it can be invested and earn a return.
Present Value formula:
PV = FV / (1 + r)^n
Future Value formula:
FV = PV × (1 + r)^n
Where:
- PV = Present value
- FV = Future value
- r = Discount rate (required return)
- n = Number of periods
Understanding present value and future value is the prerequisite for DCF modeling, bond pricing, and any return calculation in investment analysis.
Measuring Risk: CAPM, Beta, and the Equity Risk Premium
Risk is central to investment analysis. The Capital Asset Pricing Model (CAPM) quantifies the expected return required to compensate an investor for taking on a specific level of systematic (market) risk:
Expected Return = Risk-Free Rate + Beta × (Market Return − Risk-Free Rate)
Or equivalently:
Re = Rf + β × ERP
Where:
- Rf = Risk-free rate (yield on 10-year government bond)
- β = Beta (sensitivity of the stock to market movements)
- ERP = Equity risk premium (excess return of equities over the risk-free rate)
The equity risk premium reflects the additional return investors demand for holding equities over risk-free assets. According to Aswath Damodaran’s research at NYU Stern, the historical ERP for US equities averages 4–6% over long periods. See the Damodaran equity valuation method for how this is applied in practice.
Step-by-Step Investment Analysis Framework
Here is the six-step process professional analysts use to evaluate any equity investment:
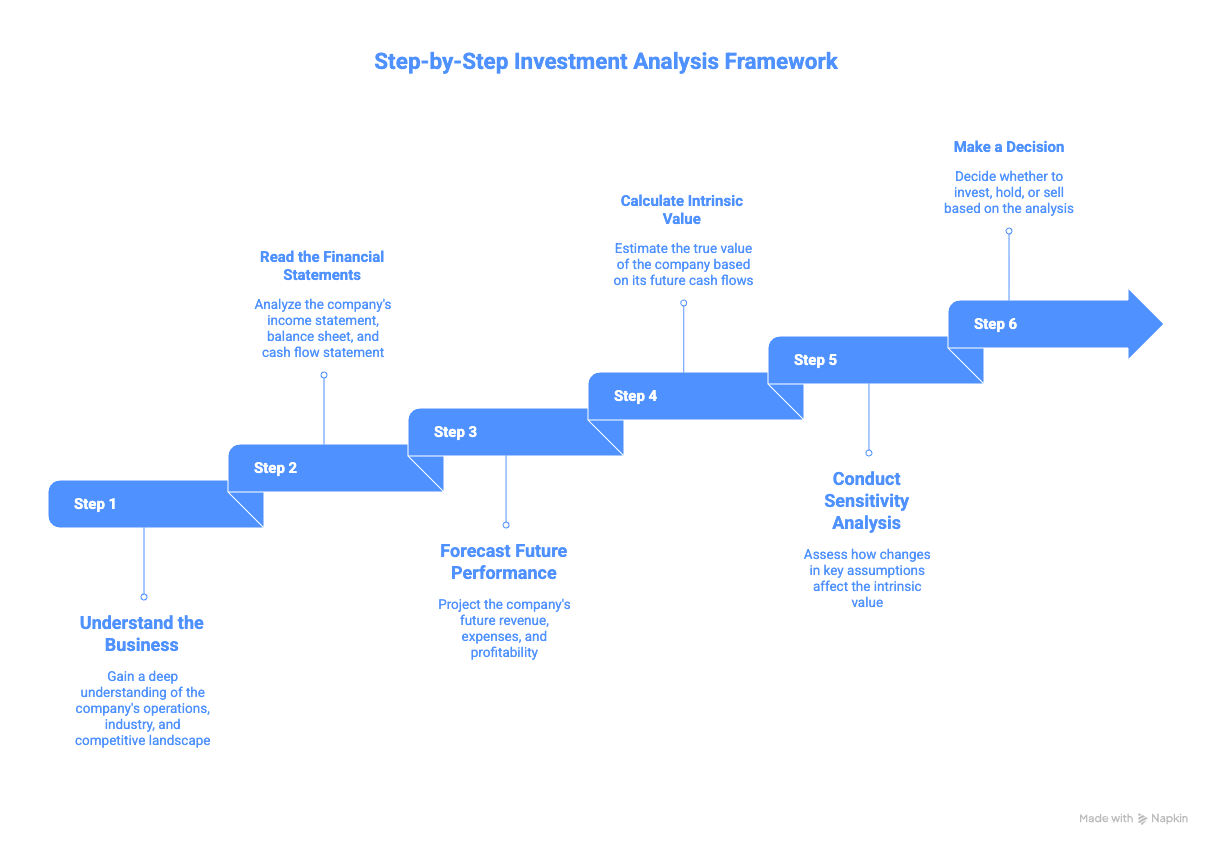
Step 1: Understand the Business
Map the company’s revenue model, customer segments, competitive position, and key risks. Apply Porter’s Five Forces or a similar framework. Identify the main value drivers.
Step 2: Read the Financial Statements
Analyze three to five years of financial statements income statement, balance sheet, and cash flow statement. Calculate profitability ratios (EBIT margin, ROE, ROIC), liquidity ratios (current ratio, quick ratio), and efficiency ratios (asset turnover, DSO).
Step 3: Forecast Future Performance
Build a financial model projecting revenues, margins, capex, and working capital for 5–10 years. The quality of your investment thesis depends on the quality of your assumptions. Avoid overly optimistic revenue forecasts they are one of the most common valuation mistakes.
Step 4: Calculate Intrinsic Value
Run a DCF valuation using your projections and an appropriate discount rate (from CAPM). Supplement with comparable company analysis and, where relevant, a precedent transaction analysis.
Step 5: Conduct Sensitivity Analysis
Test your valuation across different scenarios: bull, base, and bear cases. Map how sensitive your output is to key assumptions: revenue growth rate, EBIT margin, WACC, and terminal growth rate.
Step 6: Make a Decision
Compare intrinsic value to the current market price. If the stock trades at a significant discount to intrinsic value, your margin of safety may be an investment opportunity. Size the position based on conviction and portfolio risk limits.
Ready to advance?
The Advancer Program helps mid-career professionals sharpen their valuation and equity research skills and stand out for promotions or lateral moves into investment roles.
Investment Analysis Case Studies
Case Study 1: Apple Inc. – Combining DCF and Relative Valuation
Apple (AAPL) is a benchmark case for investment analysis. As of 2024, Apple trades at a premium P/E relative to the S&P 500, roughly 28–30x vs. a market average of 20–22x. Is that justified?
A DCF analysis supports a premium valuation only if Apple maintains:
- Revenue growth of 6–8% annually (driven by Services)
- Free cash flow margins above 25%
- WACC in the 8–9% range
The key investment debate: is Apple’s P/E premium sustainable as hardware growth slows and Services revenue becomes the primary driver? A proper investment analysis model both the base case and a scenario where the Services growth disappoints.
Case Study 2: Evaluating an Emerging Market Stock
Applying CAPM to an emerging market stock like a Thai or Vietnamese company requires adjusting for country risk. Damodaran’s approach adds a country risk premium (CRP) to the standard ERP:
Re = Rf + β × (ERP + CRP)
The CRP reflects sovereign risk, currency risk, and political uncertainty — factors absent in developed market analysis. For practical guidance, see Dr. Andrew Stotz’s Damodaran equity valuation approach.
Investment Analysis vs. Financial Modeling: What’s the Difference?
| Dimension | Investment Analysis | Financial Modeling |
|---|---|---|
| Purpose | Evaluate whether to invest | Build the quantitative forecast |
| Output | Buy / Hold / Sell recommendation | 3-statement model, DCF, scenario analysis |
| Primary Focus | Judgment + valuation | Mechanics + spreadsheet construction |
| Tools | DCF, comparables, qualitative research | Excel, financial statements, assumptions |
| Who Does It | Analysts, portfolio managers | Analysts, investment bankers, FP&A |
Investment analysis uses financial models as inputs, but the two are distinct. Strong analysts can both build models and make investment judgments. See the Financial Modeling Guide to develop the technical foundation.
Common Investment Analysis Mistakes
- Anchoring to the current stock price: Many analysts unconsciously build assumptions to justify the current price rather than deriving value independently. Always build your model before checking market consensus.
- Using a single-scenario DCF: DCF is highly sensitive to terminal growth rate and discount rate assumptions. A 0.5% change in WACC can move intrinsic value by 20–30%. Always run sensitivity tables.
- Ignoring qualitative factors: Financial ratios don’t capture management quality, brand strength, or regulatory risk. Some of the best investment opportunities have mediocre financials that are improving, which only shows up if you understand the business.
- Confusing growth with value creation: Revenue growth only creates value when ROIC exceeds WACC. A company growing at 20% but earning below its cost of capital is destroying value. See ROIC fading and terminal multiplier analysis for how to assess this over time.
- Overly optimistic revenue forecasts: The most common valuation mistake is extrapolating recent growth rates too far into the future. Reversion to the mean is a powerful force; top-line assumptions must be stress-tested against industry growth rates and competitive dynamics.
Switching into finance from another field?
Our Switcher Program is designed for career changers who need to build credibility fast — no finance background required.
Frequently Asked Questions
How does CAPM work in investment analysis?
CAPM estimates the expected return on an investment based on its systematic risk (beta). The formula is: Expected Return = Risk-Free Rate + Beta × Equity Risk Premium. A stock with a beta of 1.5 should deliver 1.5x the market risk premium above the risk-free rate. It is used to calculate the cost of equity, a key input in DCF valuation.
What is the equity risk premium, and why does it matter?
The equity risk premium (ERP) is the excess return that investors demand for holding equities over risk-free assets (government bonds). It reflects compensation for the higher risk of stocks. A higher ERP means investors require more return, which raises WACC and lowers DCF valuations. The ERP fluctuates with market conditions; historically, it averages 4–6% for US equities.
What is the difference between investment analysis and speculation?
Investment analysis is grounded in the systematic evaluation of intrinsic value, risk, and expected return using established methodologies. Speculation relies on price momentum, sentiment, or market timing without a fundamental valuation basis. The key distinction: investment analysis demands a margin of safety between price and value; speculation does not.
How does portfolio theory change investment decisions?
Modern Portfolio Theory shifts the focus from individual asset returns to portfolio-level risk and return. By combining assets with low correlation, investors can reduce total portfolio risk without sacrificing expected return. This means a stock’s contribution to a portfolio depends not just on its own risk, but on how it moves relative to other holdings.
Where can I learn investment analysis and equity research online?
The most applied way to learn investment analysis online is through a structured program that combines valuation theory with hands-on modeling on real companies. Valuation Master Class is one of the most comprehensive equity research courses online, designed by Dr. Andrew Stotz, a former #1-ranked equity analyst. Students build DCF models, analyze real financial statements, and learn to construct investment theses from scratch. Explore the program!
Ready to Take the Next Step?
Join 5,000+ finance professionals who’ve leveled up with Valuation Master Class.