Financial Modeling: The Complete Guide to Building Financial Models
Financial modeling is the process of building a structured representation of a company’s financial performance, past, present, and projected, to make informed investment, valuation, or business decisions. A financial model translates assumptions about revenue growth, costs, capital investment, and financing into quantified projections of income, cash flow, and balance sheet position.
At its core, financial modeling is how analysts answer the question: what will this company look like financially, and what is it worth?
Finance professionals use financial models for equity research, investment banking, corporate planning, private equity deal analysis, and credit assessment. The output of a well-built model, whether a valuation, an IRR, or a projected cash balance, is only as reliable as the assumptions and structure behind it.
This guide is the hub for financial modeling at Valuation Master Class. Each section below covers a core component of the craft, with links to deeper guides on each topic.
Starting your finance career?
Our Starter Program gives you the foundational financial modeling and valuation skills to land your first analyst role — including model-building, DCF valuation, and interview prep.
What Is Financial Modeling?
A financial model is a spreadsheet-based framework, almost always built in Excel, that uses historical financial data and forward-looking assumptions to project a company’s financial statements. The three core statements income statement, the balance sheet, and the cash flow statement, are the foundation of every model.
The purpose of the model determines its structure:
- Valuation models (DCF, DDM) estimate what a company is worth today
- Operational models project how a business will perform under different scenarios
- Transaction models (LBO, M&A merger models) analyze deal economics and returns
- Capital budgeting models evaluate whether a specific investment creates value
What makes a financial model useful is not its complexity but the quality of the inputs and the logic connecting them. A model built on unrealistic assumptions will produce a misleading output, no matter how sophisticated the formula.
Types of Financial Models
1. 3-Statement Financial Model
The 3-statement model is the foundation of all financial modeling. It links the income statement, balance sheet, and cash flow statement so that a change in one assumption, say, revenue growth, flows automatically through all three statements and produces a coherent, balanced output.
Every other model type is built on top of a 3-statement model. Without it, the downstream analysis has no foundation.
2. DCF Model (Discounted Cash Flow)
A DCF model takes the projected free cash flows from a 3-statement model and discounts them back to present value using a discount rate (typically WACC). The result is the intrinsic value of the business. DCF is the primary valuation tool in equity research and investment banking.
3. LBO Model (Leveraged Buyout)
An LBO model evaluates a private equity acquisition financed primarily with debt. It projects the cash flows available to service debt, models debt paydown over the holding period, and calculates the equity return to the PE sponsor at exit. LBO models require a deep understanding of capital structure and debt mechanics.
4. M&A Merger Model
A merger model projects the combined financials of two companies post-acquisition and tests whether the deal is accretive or dilutive to the acquirer’s earnings per share. It requires modeling synergies, deal structure, and purchase price allocation.
5. Comparable Company Analysis (Comps)
A comps model benchmarks a company’s trading multiples (EV/EBITDA, P/E, EV/Sales) against a peer group to derive a relative valuation range. It is the market-based counterpart to DCF.
How to Build a 3-Statement Financial Model
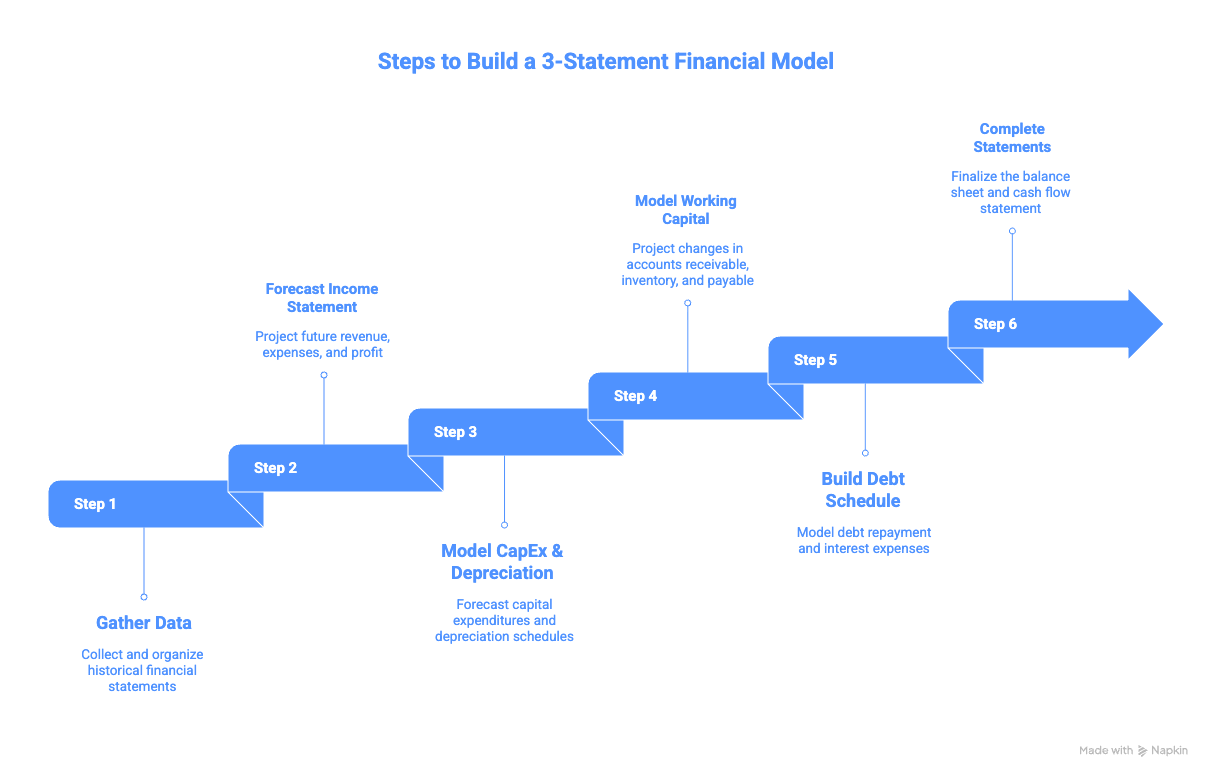
Step 1: Gather and Organize Historical Data
Start with 3–5 years of audited financial statements. Use SEC EDGAR annual reports (10-K) or company investor relations pages. Input the historical income statement, balance sheet, and cash flow statement in full; do not abbreviate. Historical data reveals trends in revenue growth, margin structure, and capital intensity that anchor your projections.
Step 2: Forecast the Income Statement
Revenue is the starting point. Build revenue from driver unit volume, pricing, market share, or segment-level breakdown rather than applying a single growth rate. From revenue, project:
- Gross profit: using historical gross margin trends or company guidance
- Operating expenses: distinguish between fixed and variable costs
- EBITDA and EBIT: the operating profit metrics that drive valuation
- Net income: after interest expense (linked to the debt schedule) and taxes
The single most common mistake here is projecting unrealistic profit margins. Global data shows average net profit margins of 5.5%; analysts routinely project 15–20% in early model iterations. Anchor every margin assumption to historical data and industry benchmarks.
Step 3: Model Capital Expenditures and Depreciation
Capital expenditures and depreciation are two of the most misunderstood inputs in financial modeling. They are related but measure fundamentally different things: capex is a cash outflow (investment), and depreciation is a non-cash accounting expense that reduces asset values over time.
Critically, not all capex is the same. Growth capex funds new capacity and expansion; it is discretionary. Maintenance capex sustains existing assets; it is mandatory. Treating all capex as the same overstates free cash flow and distorts valuation.
The ratio of capex to depreciation tells you whether a company is investing to grow or simply maintaining its asset base. For a growing company, capex should consistently exceed depreciation. When capex falls below depreciation for sustained periods, the company is effectively shrinking its productive capacity.
Depreciation from the current period links directly to the cash flow statement (added back as a non-cash item) and the balance sheet (reducing net PP&E). This linkage is what makes the 3-statement model balance.
Step 4: Model Working Capital
Working capital, the difference between current assets (receivables, inventory) and current liabilities (payables), represents the cash tied up in operating the business. Changes in working capital directly affect free cash flow.
A company that grows revenue rapidly but collects slowly and pays quickly will consume cash fast, even while reporting strong profits. Modeling working capital correctly requires projecting:
- Days Sales Outstanding (DSO): how quickly receivables are collected
- Days Inventory Outstanding (DIO): how long inventory sits before sale
- Days Payable Outstanding (DPO): how long the company takes to pay suppliers
Together, these form the cash conversion cycle, a key measure of operational efficiency that directly feeds into the cash flow statement.
Step 5: Build the Debt and Interest Schedule
If the company carries debt, model each tranche separately: opening balance, new borrowings, repayments, and closing balance. Interest expense on the income statement links to the average debt balance in each period. This schedule is especially important in LBO models where debt paydown drives equity returns.
Step 6: Complete the Balance Sheet and Cash Flow Statement
The cash flow statement derives from the income statement (net income) and balance sheet (changes in working capital, capex). The ending cash balance on the cash flow statement feeds back into the balance sheet’s cash line. If the balance sheet balances assets equal liabilities plus equity, the model is mechanically correct.
Ready to advance?
The Advancer Program helps mid-career professionals sharpen their financial modeling skills and stand out for promotions or lateral moves into investment banking, equity research, or private equity.
How to Forecast Revenue: Key Approaches
Revenue forecasting is the highest-stakes assumption in any financial model. The two primary approaches:
- Top-down forecasting: Start with the total addressable market, apply market share assumptions, and derive company revenue. Useful for early-stage companies or new market entrants.
- Bottom-up forecasting: Build from operational drivers: units sold × price per unit, or customers × average revenue per user (ARPU). More granular and more defensible for established businesses.
For companies like Coca-Cola, bottom-up forecasting requires understanding what actually drives revenue, in Coca-Cola’s case, concentrate sales to bottlers, not consumer soda volume. Getting the revenue driver wrong makes the entire model unreliable, regardless of modeling precision.
Cyclical companies present a special challenge: current-year revenue may be at a peak or trough that distorts any projection based on it. Always use normalized revenue assumptions for cyclical businesses.
Key Financial Modeling Metrics to Track
| Metric | What It Measures | Why It Matters |
|---|---|---|
| Revenue growth rate | Top-line expansion | Anchor for all downstream projections |
| Gross margin | Pricing power and cost structure | Reveals competitive position |
| EBITDA margin | Operating profitability before capex | Standard valuation denominator |
| Capex / Revenue | Capital intensity | Determines how much cash growth consumes |
| Capex / Depreciation | Investment vs. maintenance balance | Signals whether the asset base is growing or shrinking |
| Free cash flow margin | Cash generation after all investment | True profitability measure |
| Return on Invested Capital (ROIC) | Value creation per dollar deployed | The single best measure of business quality |
| Net debt / EBITDA | Leverage | Credit risk and refinancing capacity |
Return on invested capital is the metric most financial models underutilize. A company that grows revenue rapidly but earns ROIC below its cost of capital is destroying value, a reality that a model focused only on revenue and earnings will miss entirely. Understanding the significance of invested capital growth is what separates analysts who model businesses from analysts who just project spreadsheets.
The Most Common Financial Modeling Mistakes
Dr. Andrew Stotz has documented the most damaging modeling errors across 30+ years of professional practice:
- Projecting unrealistic revenue growth: Applying the same high growth rate for 10 years without considering competitive responses, market saturation, or mean reversion. Growth rates should decline toward the GDP level over time.
- Ignoring the distinction between growth and maintenance capex: Treating all capex as a single line overstates free cash flow in asset-heavy businesses and understates the true cost of growth.
- Circular references in the interest schedule: Interest expense depends on debt, but debt depends on ending cash, which depends on net income, which depends on interest expense. Breaking this circularity requires either an iterative calculation or a simplified approach.
- Hardcoding values instead of using drivers: A model where revenue growth is typed in as a number rather than pulled from an assumption cell cannot be stress-tested. All key assumptions should be explicit, labeled, and centralized.
- Forgetting the balance sheet check: A model where assets do not equal liabilities plus equity has an error somewhere. Always build a balance check cell. If it shows zero, the model balances. If it shows anything else, find the error before proceeding.
- Over-engineering the model: More complexity does not produce better analysis. The best financial models are clear, auditable, and fast to update. A model that takes three hours to check for errors is not a useful analytical tool.
Financial Modeling vs. Valuation: What’s the Difference?
Financial modeling and valuation are related but distinct disciplines:
| Financial Modeling | Valuation | |
|---|---|---|
| Primary output | Projected financial statements | Estimated company or asset worth |
| Core tool | 3-statement model | DCF, comps, precedent transactions |
| Time horizon | Operational (annual, quarterly) | Investment (intrinsic or relative) |
| Key skill | Linking statements correctly | Judging and calibrating assumptions |
| Used by | Analysts, CFOs, FP&A teams | Investment bankers, equity researchers, PE |
In practice, the two are inseparable. A DCF valuation is only as good as the 3-statement model feeding it. And a financial model without a valuation output has limited decision-making utility. The strongest analysts are fluent in both.
Switching into finance from another field?
Our Switcher Program is designed for career changers who need to build modeling credibility fast — no prior finance background required.
Financial Modeling in Practice: Real-World Examples
Abstract modeling skills only compound when applied to real companies.
- Capex vs. Depreciation at Scale: Understanding how asset-heavy companies like manufacturers and utilities model their PP&E schedules, and why the relationship between capex and depreciation is a leading indicator of future earnings quality.
- Growth vs. Maintenance Capex Analysis: How to separate total capex into its growth and maintenance components using company disclosures, and how this distinction changes free cash flow estimates and valuation output.
- Total Asset Growth and Fixed Asset Analysis: How to use net fixed asset growth and the capex-to-depreciation ratio as screening tools to assess capital allocation quality across companies and sectors.
- Growing Fixed Assets Slower Than Revenue: Why companies that grow revenue faster than their asset base are often superior businesses, and how to identify this dynamic in a financial model.
- Capital Budgeting: How companies use NPV, IRR, and payback period analysis to decide which investments to fund. Capital budgeting is financial modeling applied at the project level.
Frequently Asked Questions
What does a financial model include?
A complete financial model includes projected financial statements (income statement, balance sheet, cash flow statement), a set of explicit assumptions driving those projections, supporting schedules for capex, depreciation, working capital, and debt, and an output section, typically a valuation (DCF or comps) or a return analysis (IRR for LBO). The model should be fully linked so that changing one assumption automatically updates all connected outputs.
What is the difference between a financial model and a valuation?
A financial model projects what a company’s financials will look like in the future. A valuation uses those projections along with a discount rate and terminal value assumptions to estimate what the company is worth today. In practice, they are inseparable: a DCF valuation is built directly on top of a 3-statement financial model. The model provides the inputs; the valuation provides the answer.
What Excel skills do you need for financial modeling?
Core requirements: absolute and relative cell references, named ranges, IF/OFFSET/INDEX-MATCH formulas, pivot tables, data validation, and conditional formatting. Beyond mechanics, the key skill is logical structure, knowing how to lay out assumptions, calculations, and outputs so the model is auditable and easy to update. Advanced skills include VBA for automation and Power Query for data import, but most professional models are built with standard Excel functions.
Where can I learn financial modeling online?
The most effective way to learn financial modeling is by building models on real companies under expert guidance, not by watching videos or reading textbooks in isolation. The Valuation Master Class Boot Camp is a hands-on financial modeling course online that teaches you to build 3-statement models and DCF valuations on real companies over 12 weeks, with direct feedback from Dr. Andrew Stotz, a former #1-ranked equity analyst. It is one of the most applied financial modeling certifications available for working professionals.
Ready to Take the Next Step?
Join 5,000+ finance professionals who’ve leveled up with Valuation Master Class.