WACC Theory vs. Reality: Why Textbook Assumptions Break Down in Practice
The weighted average cost of capital (WACC) is one of the most important numbers in company valuation, and one of the hardest to estimate accurately. In theory, WACC is a clean formula that blends a company’s cost of equity and after-tax cost of debt into a single discount rate. In reality, every input in that formula requires judgment calls that can swing a valuation by 20% or more.
According to Morgan Stanley research, even best-practice firms can only estimate WACC within plus or minus 100 to 150 basis points of the true rate. Nearly half of the surveyed finance professionals admitted their discount rate was likely at least 1% above or below the company’s actual cost of capital. That level of imprecision is significant; in a DCF valuation, a 1% change in WACC can change the equity value by 15-25%.
This article is not about what WACC is or how to calculate it; for that, see our complete WACC formula and calculation guide. This article is about what goes wrong when you try to estimate WACC for a real company, and what experienced analysts do about it.
The WACC Formula: Simple in Theory
WACC = (E/V * COE) + (D/V) * COD * (1 – T)
Where,
- E = Market value of equity
- V = Total market value of equity and debt
- COE = Cost of equity
- D = Market value of debt
- COD = Cost of debt
- T = Corporate tax rate
On paper, this formula is straightforward. You estimate the cost of equity, estimate the after-tax cost of debt, weight each by its share of total capital, and sum them. In practice, every single variable in that formula is subject to estimation error, judgment calls, and real-world complications that textbooks gloss over.
Starting your finance career?
If you are building your foundation in DCF valuation and financial modeling, our Starter Program gives you the skills to land your first analyst role, including DCF valuation, financial modeling, and interview preparation.
WACC Is What the Company Pay Investors and Creditors
The average rate of return that a company pays to all investors in the company. It is commonly referred to as the firm’s cost of capital. Investors include creditors, owners, and other providers of capital.
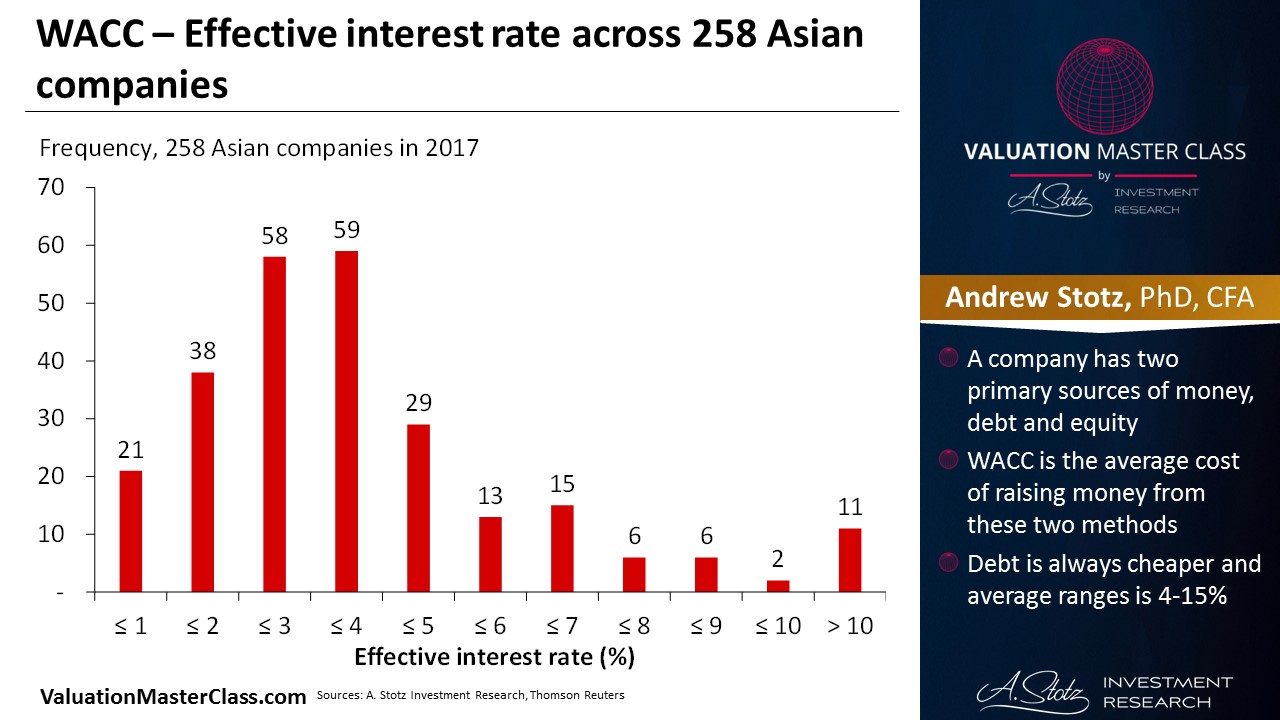
A company has two primary sources of capital: debt and equity. WACC is the average cost of raising money from these two sources. The WACC is calculated taking into account the relative weights and costs of each.
What Is the Cost of Debt (COD)?
The total amount of interest that a firm pays on all its debt. What lenders demand in compensation for the risk exposure they take when lending to a company.
Since dividends are considered after taxes and they are part of the COE, in the WACC calculation, we adjust the interest, reducing it depending on the tax rate.
An optimal capital structure is the capital structure that lowers the WACC to its lowest. Usually, when the company grows, the debt grows as well.
Debt is always cheaper; an average range is 4-15%. Equity usually ranges from 8-20%.
A company can rarely keep on financing itself like this forever with a debt over 50% of its capital structure.
As this means banks are putting their money into the company more than the equity owners themselves.
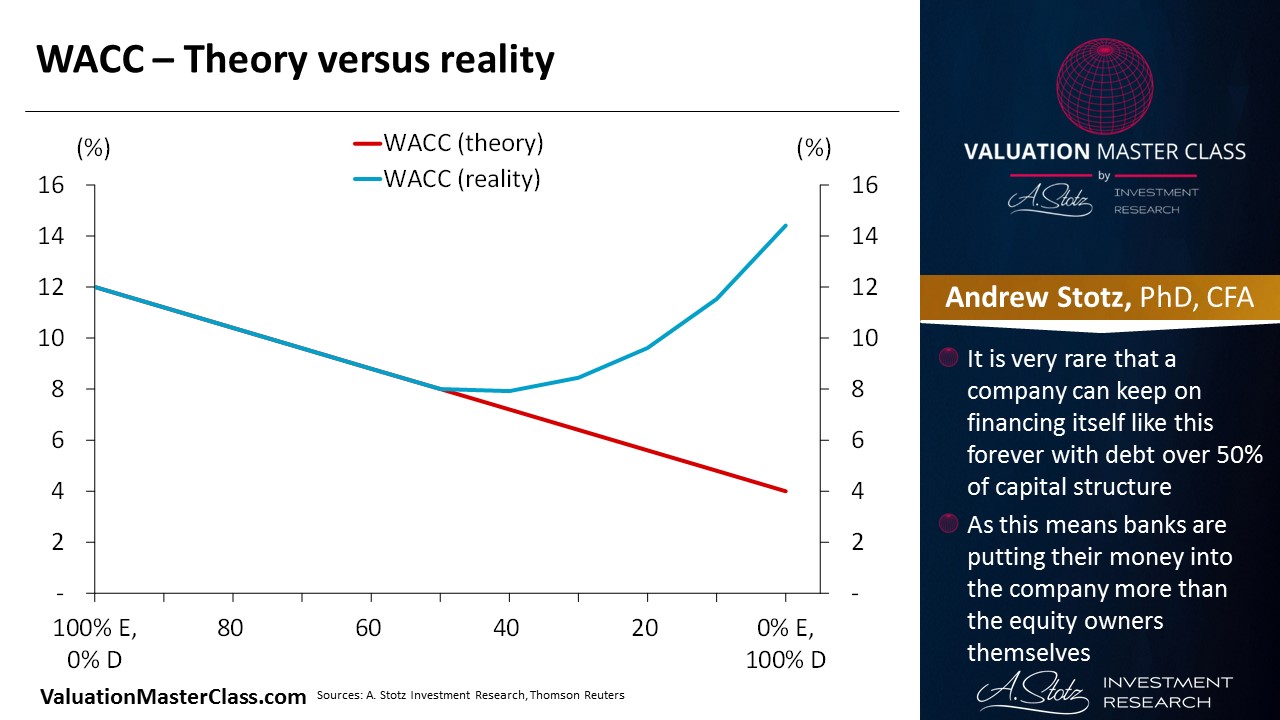
This can happen for a short period when the company is distressed, but not over long periods.
Why Do WACC Assumptions Break Down in Practice?
Textbook WACC rests on several assumptions that rarely hold in the real world. Understanding where these assumptions fail and how to compensate is what separates a mechanical WACC calculation from a defensible one.
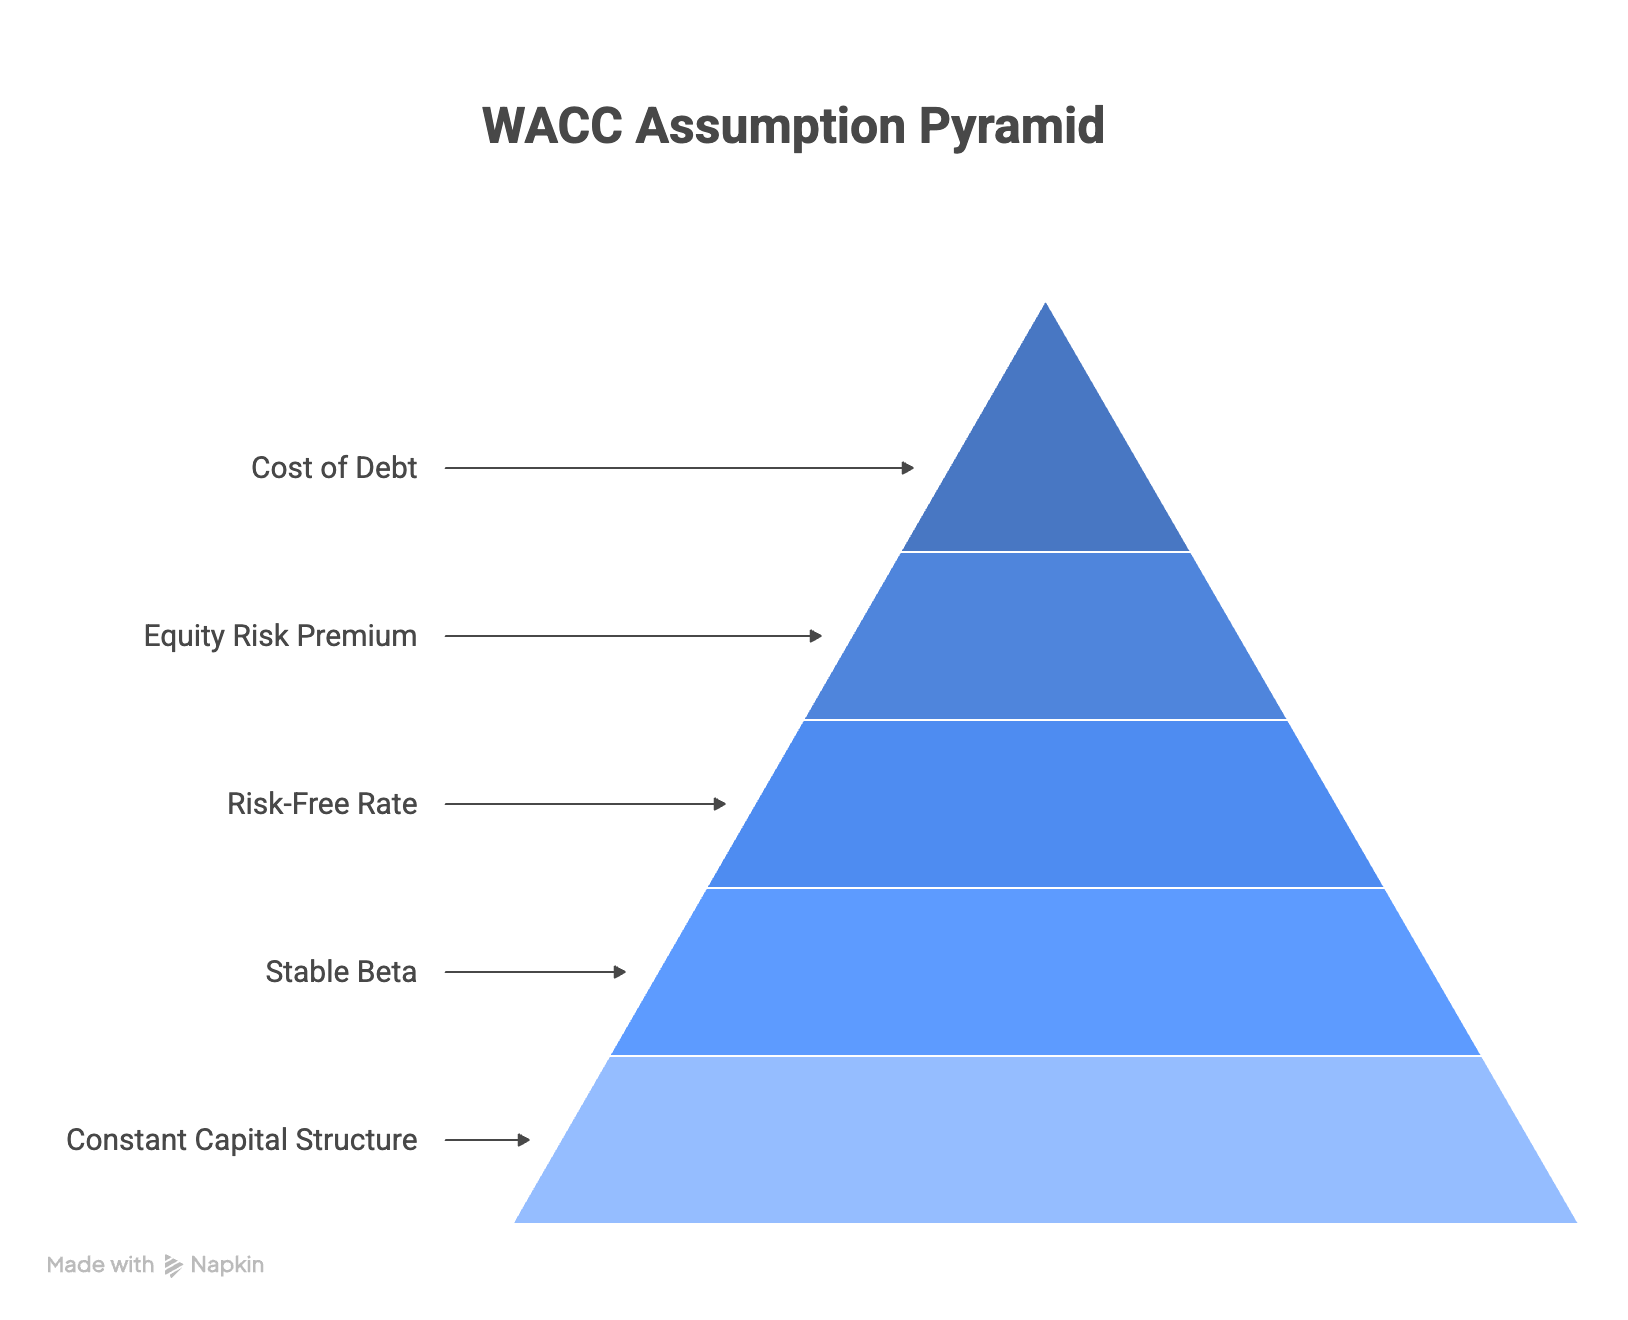
Assumption 1: Capital Structure Stays Constant
The theory: WACC uses fixed weights for debt and equity. Most textbooks and models apply a single WACC across the entire forecast period, implying the company maintains the same debt-to-equity ratio indefinitely.
The reality: Companies constantly adjust their capital structures. They issue debt to fund acquisitions, buy back shares when cash is abundant, and deleverage during downturns. A firm’s debt-to-equity ratio in 2024 may bear no resemblance to its ratio in 2029.
What practitioners do:
- Use a target capital structure based on management guidance, industry averages, or analyst estimates rather than the current snapshot
- For companies undergoing significant leverage changes (LBOs, restructurings), use a time-varying WACC that adjusts the weights year by year
- Cross-check against the optimal capital structure for the industry if the company is far from the optimum; mean reversion is likely
Assumption 2: Beta Is Stable and Measurable
The theory: The Capital Asset Pricing Model (CAPM) uses beta to measure a stock’s systematic risk. Beta comes from regressing stock returns against a market index over a historical period.
The reality: Calculated beta is notoriously unreliable. A single company’s beta can change dramatically depending on the time period chosen (2 years vs. 5 years), the market index used (S&P 500 vs. MSCI World), and the return frequency (daily vs. weekly vs. monthly). Company-specific events during the measurement window can distort the correlation entirely.
As Professor Aswath Damodaran has noted, the standard error on most beta estimates is so large that the confidence interval is practically useless for individual stocks. This is why using calculated beta directly in a valuation is one of the most common valuation mistakes.
What practitioners do:
- Use industry-average unlevered betas from Damodaran’s datasets rather than a single company’s calculated beta
- Revalue the industry beta using the company’s target capital structure
- Apply judgment: a utility company should have a beta near 0.4-0.6 regardless of what regression outputs suggest; a tech startup should be 1.2+ regardless of limited trading history
Assumption 3: The Risk-Free Rate Is Truly Risk-Free
The theory: The risk-free rate is the 10-year government bond yield, and it represents the return on a zero-risk investment.
The reality: Government bonds are only “risk-free” in the sense that sovereigns can print money. In practice:
- During periods of quantitative easing (2009-2021), government bond yields were artificially suppressed, producing risk-free rates far below equilibrium
- During rapid tightening (2022-2023), rates spiked, causing WACC estimates to jump 200-300 bps in months
- For valuations in emerging markets, local government bonds embed credit and currency risk; they are not risk-free
- Long-term valuations (10+ year DCFs) may need a normalized risk-free rate rather than today’s spot rate
What practitioners do:
- Use a normalized risk-free rate (e.g., 3.5-4.5% for USD valuations) when current rates are at extremes
- For emerging market companies, start with a developed-market risk-free rate and add a country risk premium separately
- Document whether the risk-free rate used is the spot rate or a normalized estimate. This is the single biggest source of WACC disagreements between analysts
Assumption 4: The Equity Risk Premium Is Known
The theory: The equity risk premium (ERP) is the extra return investors demand for holding stocks over risk-free bonds. It is a single number you look up or estimate.
The reality: There is no consensus on the equity risk premium. Different sources give materially different numbers:
| Source | Typical US ERP Estimate |
|---|---|
| Historical average (1926–2024, arithmetic) | 6.5–7.5% |
| Historical average (1926–2024, geometric) | 4.5–5.5% |
| Damodaran implied ERP (forward-looking) | 4.0–5.5% (varies annually) |
| Survey of CFOs (Duke/CFO Survey) | 3.0–5.0% |
| Dimson-Marsh-Staunton global historical | 3.0–5.0% |
A 2% difference in ERP translates directly into a 2% difference in cost of equity, which flows through to WACC and can change a DCF valuation by 20-30%. This is not a rounding error; it is a fundamental modeling choice.
What practitioners do:
- Use Damodaran’s annually updated implied ERP, which is forward-looking and reflects current market conditions
- Be consistent within a valuation: do not mix a historical ERP with an implied risk-free rate
- Add a country risk premium for companies operating in emerging or frontier markets (Damodaran publishes these annually)
Assumption 5: The Cost of Debt Is the Interest Rate on the Books
The theory: The cost of debt is the company’s borrowing rate. Multiply by (1 – tax rate) to get the after-tax cost.
The reality: Most companies have multiple debt instruments with different maturities, seniorities, covenants, and rates. The “cost of debt” is really a weighted average across:
- Senior secured loans (lowest rate)
- Senior unsecured bonds (moderate rate)
- Subordinated debt/mezzanine (high rate)
- Revolving credit facilities (variable rate)
- Operating leases (often excluded but represent real obligations)
Furthermore, the tax shield assumes the company is profitable enough to fully utilize interest deductions. For loss-making companies, the tax shield is partially or fully worthless the effective after-tax cost of debt is closer to the pre-tax rate.
What practitioners do:
- Calculate a weighted average cost across all debt instruments, not just the largest one
- Include capitalized operating leases in the debt figure (per IFRS 16 / ASC 842)
- For unprofitable companies, use a blended tax rate that reflects the probability of utilizing the tax shield over the forecast period
- Use the yield to maturity on traded bonds rather than the coupon rate (which reflects the rate when the bond was issued, not the market’s current view)
How Does WACC Estimation Error Affect Valuations?
Small WACC changes produce large valuation swings. This is not intuitive to junior analysts, which is why sensitivity analysis is essential.
WACC Sensitivity: A Practical Example
Consider a company with $100 million in projected free cash flow growing at 3% in perpetuity. Here is how the terminal value changes with small WACC adjustments:
| WACC | Terminal Value (Perpetuity) | Change from 10% Base |
|---|---|---|
| 8.0% | $2,000M | +43% |
| 9.0% | $1,667M | +19% |
| 9.5% | $1,538M | +10% |
| 10.0% | $1,400M | Base case |
| 10.5% | $1,333M | −5% |
| 11.0% | $1,250M | −11% |
| 12.0% | $1,111M | −21% |
A 2-percentage-point swing in WACC (8% to 10%) changes the terminal value by 43%. When WACC is embedded in a full DCF model with a multi-year forecast period, the compounding effect is even larger.
This is why Morgan Stanley’s finding that WACC is accurate to plus or minus 100-150 bps at best matters so much. You are building your entire valuation on a discount rate that inherently carries significant uncertainty.
How to Run a WACC Sensitivity Analysis
Every DCF should include a sensitivity table that varies WACC against the terminal growth rate. Here is a standard approach:
- Establish your base case WACC: Using the methodology above
- Define a reasonable range: Typically +/- 1.0% from base case (e.g., 8.5% to 10.5% for a base case of 9.5%)
- Vary the terminal growth rate: Independently, typically 1.5% to 3.5% for mature companies
- Build a two-way data table: Showing implied equity value per share at each combination
- Identify the range of fair values: This is your valuation range, not a single point estimate
- Stress test extremes: What happens to the valuation if WACC hits 12%? (recession scenario) Or drops to 7%? (aggressive bull case)
The sensitivity table is arguably more valuable than the single-point DCF output because it forces you to confront the uncertainty in your assumptions.
Ready to advance?
If you already understand WACC mechanics but want to sharpen your valuation and equity research skills, the Advancer Program helps mid-career professionals build defensible models and stand out for promotions or lateral moves into investment roles.
What WACC Mistakes Do Experienced Analysts Still Make?
Even seasoned professionals fall into these traps when estimating WACC for real companies:
Mistake 1: Using a Single WACC for All Business Segments
Conglomerates and diversified companies have divisions with very different risk profiles. A consumer staples division and a technology division within the same company should not share the same cost of capital. Using the corporate-level WACC to evaluate a high-risk project understates the true discount rate and overstates the project’s value.
Fix: Use segment-level WACCs based on industry-comparable betas and appropriate capital structure assumptions for each division.
Mistake 2: Ignoring the Circularity Problem
WACC requires market value weights, but the equity value is what you are trying to calculate with the DCF. This creates a circular reference: you need WACC to calculate equity value, but you need equity value to calculate WACC.
Fix: Use an iterative approach (set up circular references in Excel with iterative calculation enabled) or use target capital structure weights based on the company’s or industry’s long-term averages.
Mistake 3: Applying Developed-Market WACC to Emerging-Market Companies
A company headquartered in Brazil, Nigeria, or Indonesia faces political risk, currency risk, and capital market inefficiencies that developed-market inputs do not capture. Using a US risk-free rate and a US ERP without adjustment dramatically understates the discount rate.
Fix: Add a country risk premium to the cost of equity. Damodaran publishes country risk premiums annually based on sovereign credit default swap spreads and credit ratings. For cyclical companies in volatile markets, the adjustment is even more critical.
Mistake 4: Not Adjusting WACC for Company Size
Small-cap and micro-cap companies face higher costs of capital than large-caps, even within the same industry. The CAPM does not capture this; it assumes all systematic risk is explained by beta.
Fix: Add a size premium (typically 1-3% for small-cap firms) based on data from Duff & Phelps / Kroll or similar sources.
Mistake 5: Treating WACC as a Fixed Number
Many analysts calculate WACC once and hardcode it into the model. But WACC should evolve with the company’s capital structure, risk profile, and market conditions across the forecast period.
Fix: For companies whose capital structure is changing materially (growth-stage firms adding debt, leveraged firms deleveraging), recalculate WACC for each forecast year, or at a minimum, model a transition from the current WACC to a target WACC.
When Does WACC Not Apply?
WACC is the standard discount rate for free cash flow to the firm (FCFF) in a DCF, but there are situations where WACC is inappropriate or must be substantially modified:
| Situation | Why WACC Fails | Alternative Approach |
|---|---|---|
| Highly leveraged/distressed firms | Capital structure is unstable; debt is risky | Adjusted Present Value (APV) values the unlevered firm + tax shields separately |
| Private companies | No market cap, no traded beta, no bond yields | Build-up method or comparable company WACC with an illiquidity premium |
| Financial institutions (banks, insurers) | Debt is an operating asset, not just financing | Cost of equity models (dividend discount, residual income); WACC is not meaningful |
| Early-stage / pre-revenue companies | No stable cash flows, no debt, extreme uncertainty | Venture capital method or scenario-based DCF with stage-appropriate discount rates |
| Project-specific decisions | Corporate WACC may not reflect project risk | Project-specific discount rate using comparable project betas |
Understanding when NOT to use WACC is as important as knowing how to calculate it. The Adjusted Present Value (APV) method, for example, avoids the circularity problem entirely by valuing the unlevered firm first and adding the value of tax shields separately.
WACC in Theory vs. WACC in Practice: Summary Comparison
| Dimension | Textbook Assumption | Real-World Reality |
|---|---|---|
| Capital structure | Fixed debt-to-equity ratio | Shifts constantly with market conditions, M&A, and buybacks |
| Beta | Stable, calculated from regression | Unreliable for individual stocks; use industry averages |
| Risk-free rate | Government bond yield | Can be distorted by monetary policy; may need normalization |
| Equity risk premium | Single consensus number | Ranges from 3% to 7.5% depending on source and methodology |
| Cost of debt | Single borrowing rate | Weighted average across multiple instruments with different terms |
| Tax shield | Fully utilized | Only if the company is profitable, partial for loss-making firms |
| Application | One WACC for the whole company | Different segments may need different discount rates |
| Time horizon | Constant over forecast | Should evolve with capital structure changes |
| Market conditions | Stable, efficient markets | Volatility, illiquidity, and information asymmetry affect every input |
How Can You Improve Your WACC Estimates?
If you are building a real valuation, here is a practical checklist for producing a defensible WACC:
- Start with industry-average unlevered beta from Damodaran’s data, not the company’s calculated beta
- Relever using target capital structure management guidance, industry average, or your own projection
- Use Damodaran’s implied equity risk premium updated annually, forward-looking
- Normalize the risk-free rate if current government bond yields are at historic extremes
- Calculate a weighted average cost of debt across all instruments, including operating leases
- Adjust the tax shield for the probability that the company actually benefits from interest deductions
- Add a country risk premium for emerging-market companies
- Add a size premium for small-cap and micro-cap firms
- Run a sensitivity analysis varying WACC +/- 1.0% against terminal growth rate +/- 0.5%
- Document every assumption. WACC is a judgment-intensive number, and reviewers need to understand your choices
The goal is not to find the “correct” WACC; it does not exist. The goal is to produce a reasonable range and understand how sensitive your valuation is to discount rate assumptions. That is what separates a beginner from someone who values the ROIC-to-WACC spread in the context of real value creation.
Frequently Asked Questions
What is the difference between WACC in theory and WACC in practice?
In theory, WACC is a formula with precise inputs cost of equity from CAPM, the after-tax cost of debt, and market-value weights. In practice, every input requires estimation and judgment. Beta is unreliable for individual stocks, the equity risk premium has no consensus value, and capital structures change over time. Best-practice firms can estimate WACC to within plus or minus 100-150 basis points at best, making sensitivity analysis essential for any real-world valuation.
Why is WACC sensitivity analysis important in DCF valuation?
Because small changes in WACC produce disproportionately large changes in valuation. A 1% change in WACC can shift a DCF valuation by 15-25% or more, depending on the growth rate and forecast horizon. Running a two-way sensitivity table varying WACC against the terminal growth rate transforms a single-point estimate into a valuation range that honestly reflects the uncertainty in your assumptions.
What are the biggest WACC estimation mistakes analysts make?
The most common mistakes include: using a company’s calculated beta instead of an industry-average beta, applying a single corporate WACC to business segments with very different risk profiles, ignoring the cost of equity estimation uncertainty embedded in the equity risk premium choice, and treating WACC as a fixed constant when the company’s capital structure is actively changing. Each of these can introduce 1-3% of error into the discount rate.
How does stock market volatility affect WACC?
Market volatility affects WACC through multiple channels. Higher volatility increases implied equity risk premiums, raising the cost of equity. It can also widen credit spreads, increasing the cost of debt. Beta estimates become less reliable during volatile periods because short-term correlations diverge from long-term patterns. Practitioners should be cautious about estimating WACC during market extremes, as normalized inputs often produce more defensible valuations.
When should you NOT use WACC as your discount rate?
WACC is inappropriate for highly leveraged or distressed firms (use Adjusted Present Value instead), financial institutions where debt is an operating asset rather than financing, private companies without observable market inputs (use a build-up method), and early-stage companies with no stable cash flows. WACC also fails as a project discount rate when the project’s risk profile differs materially from the company’s overall risk.
How do you estimate WACC for a private company?
Private companies lack market capitalization, traded beta, and observable bond yields, the three key WACC inputs. Practitioners use comparable public company betas (unlevered, then relevered for the private company’s capital structure), add an illiquidity premium of 1-4%, and estimate cost of debt from the company’s credit profile or comparable lending rates. The equity risk premium typically uses the same Damodaran dataset, with additional size and company-specific risk premiums as needed.
Where can I learn to apply WACC in real company valuations?
The best way to master WACC estimation is through hands-on practice with real companies, not just theory. Valuation Master Class teaches you to build DCF models, estimate WACC using industry data, run sensitivity analyses, and defend your assumptions with the same skills used by professional equity analysts and investment bankers. The program is designed by Dr. Andrew Stotz, a former top-ranked analyst, and includes real company valuation case studies where WACC estimation is a core component.
Switching into finance from another field?
If you are transitioning into finance and need structured credibility building, our Switcher Program is designed for career changers who need to build practical valuation skills fast, even without a finance background.