PepsiCo vs Coca-Cola: Why PepsiCo’s Profit Margin Is Half of Coke
Why Is PepsiCo’s Profit Margin Half of Coca-Cola’s?
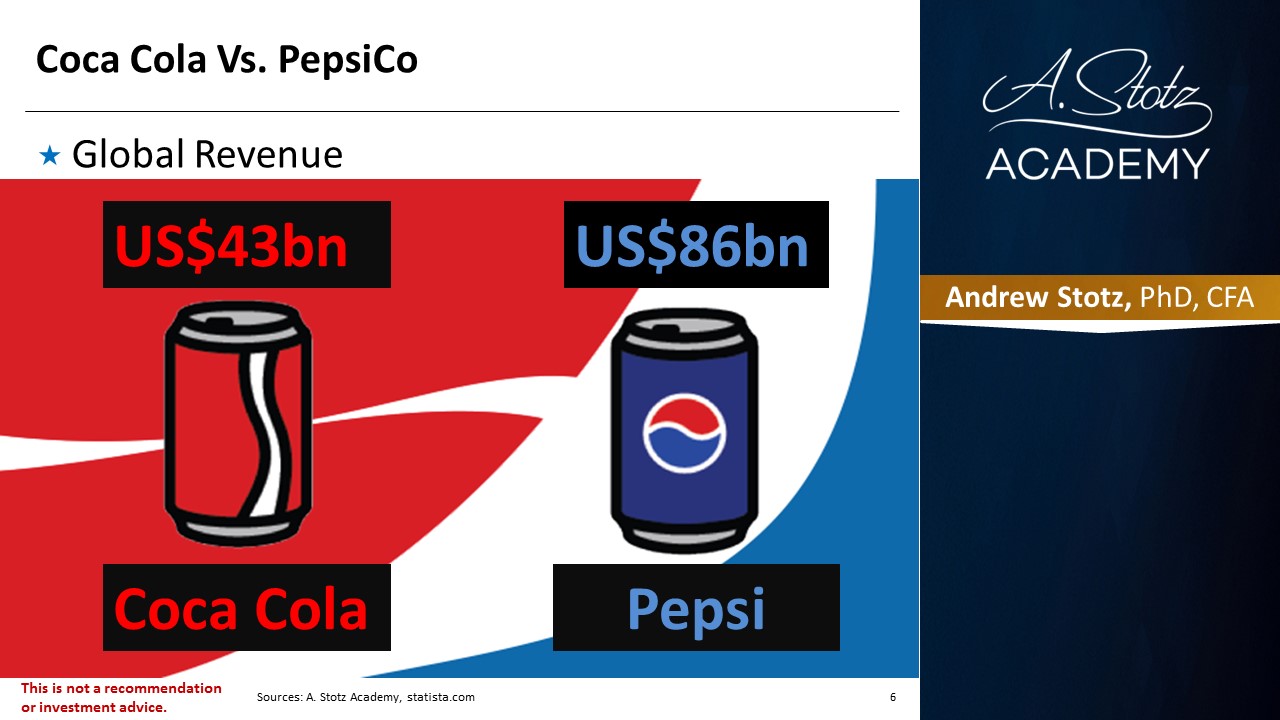
PepsiCo (NASDAQ: PEP) generates nearly twice the revenue of Coca-Cola (NYSE: KO), $91.9 billion vs $47.7 billion, yet its net profit margin is roughly half: approximately 10% compared to Coca-Cola’s 23%. The reason comes down to business model: Coca-Cola is a pure-play beverage company that earns 60-80% gross margins on concentrate sales, while PepsiCo operates a diversified food-and-beverage empire spanning Frito-Lay snacks, Gatorade, Quaker Oats, and Pepsi-branded beverages. No, Coca-Cola does not own PepsiCo; they are entirely separate, publicly traded competitors.
| Metric | PepsiCo (PEP) | Coca-Cola (KO) |
|---|---|---|
| Annual Revenue (FY2024) | $91.9 billion | $47.7 billion |
| Net Profit Margin | ~10.4% | ~22.6% |
| Gross Profit Margin | ~54.6% | ~61.1% |
| Net Income (FY2024) | $9.6 billion | $10.6 billion |
| Business Model | Beverages + snacks + foods | Pure-play beverages (concentrate-heavy) |
| Number of $1B+ Brands | 23 | 26 |
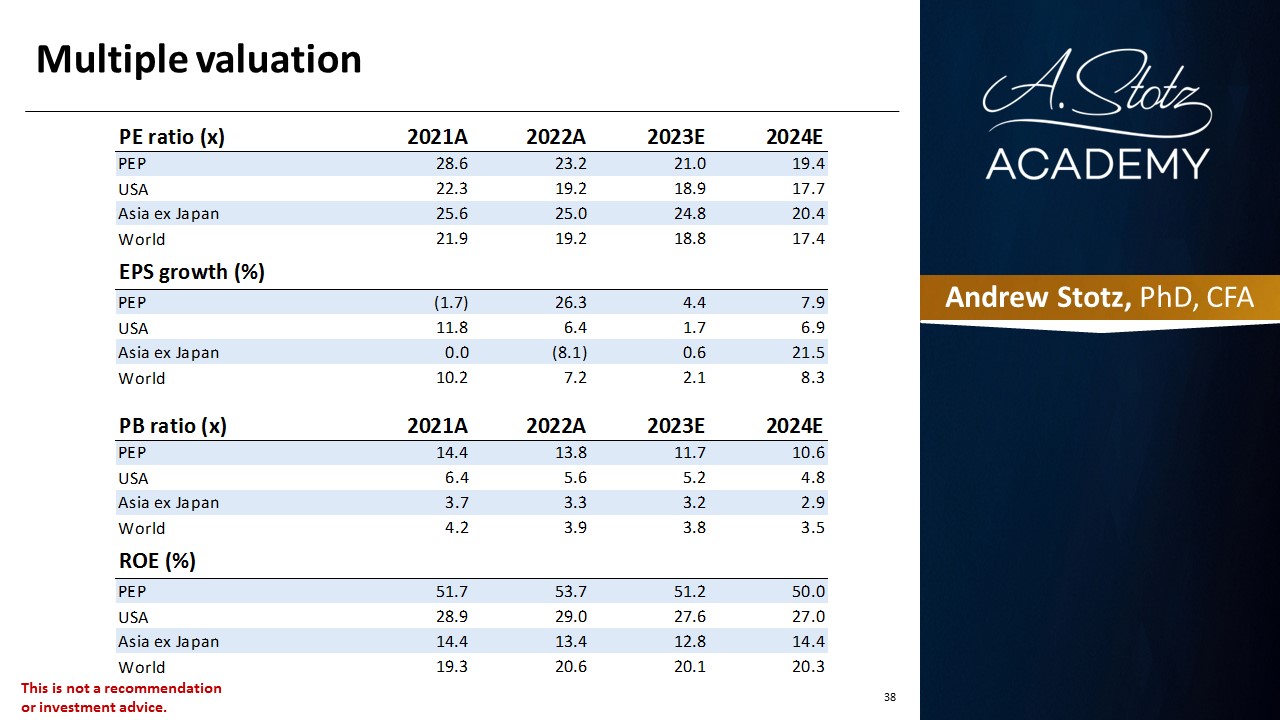
| P/E Ratio | ~22x | ~26x |
| Dividend Streak | 50+ years of increases | 60+ years of increases |
Starting your finance career?
Our Starter Program gives you the foundational skills to land your first analyst role, including DCF valuation, financial modeling, and interview prep.
Here’s a breakdown of why PepsiCo’s margins are structurally lower, what PepsiCo owns, and what this means for company valuation.
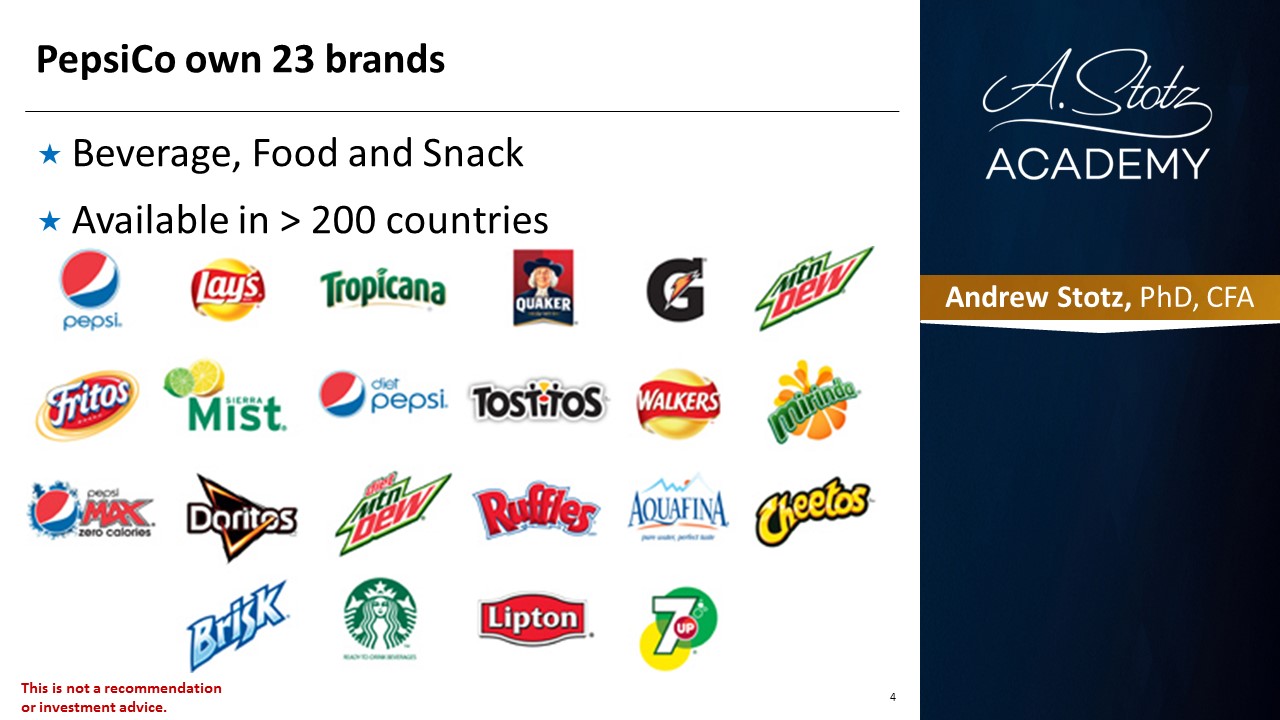
PepsiCo Owns 23 Brands
- Beverage, Food, and Snack
- Available in > 200 countries
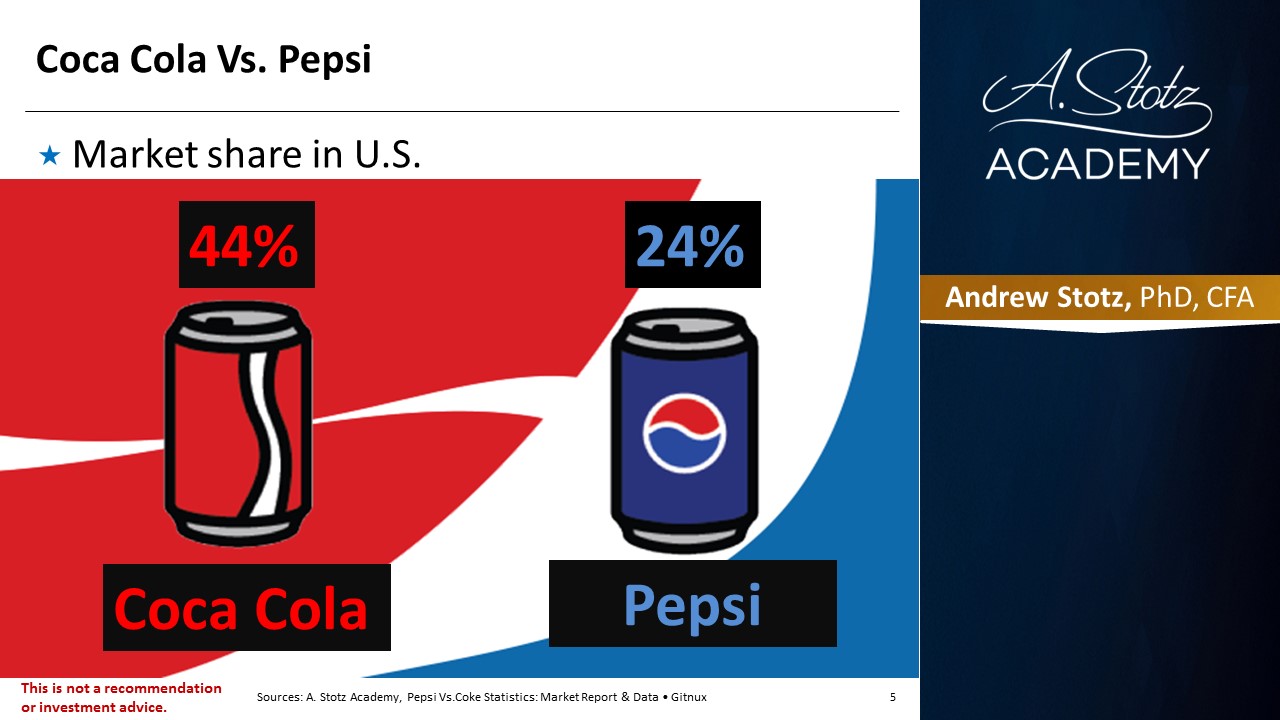
Coca Cola Vs. Pepsi
- Market share in the U.S.
Coca Cola Vs. PepsiCo
- Global Revenue
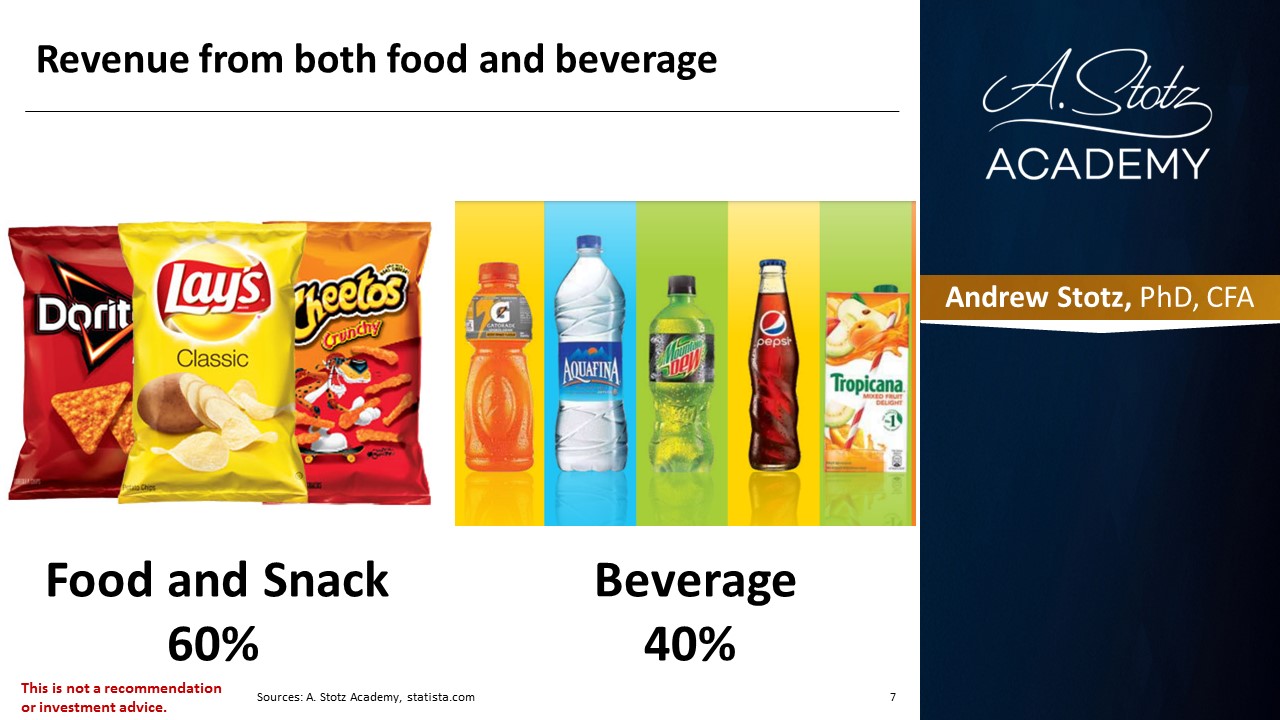
Revenue from Both Food and Beverage
Most Valuable Brand in Beverage
Most Valuable Brand in Food
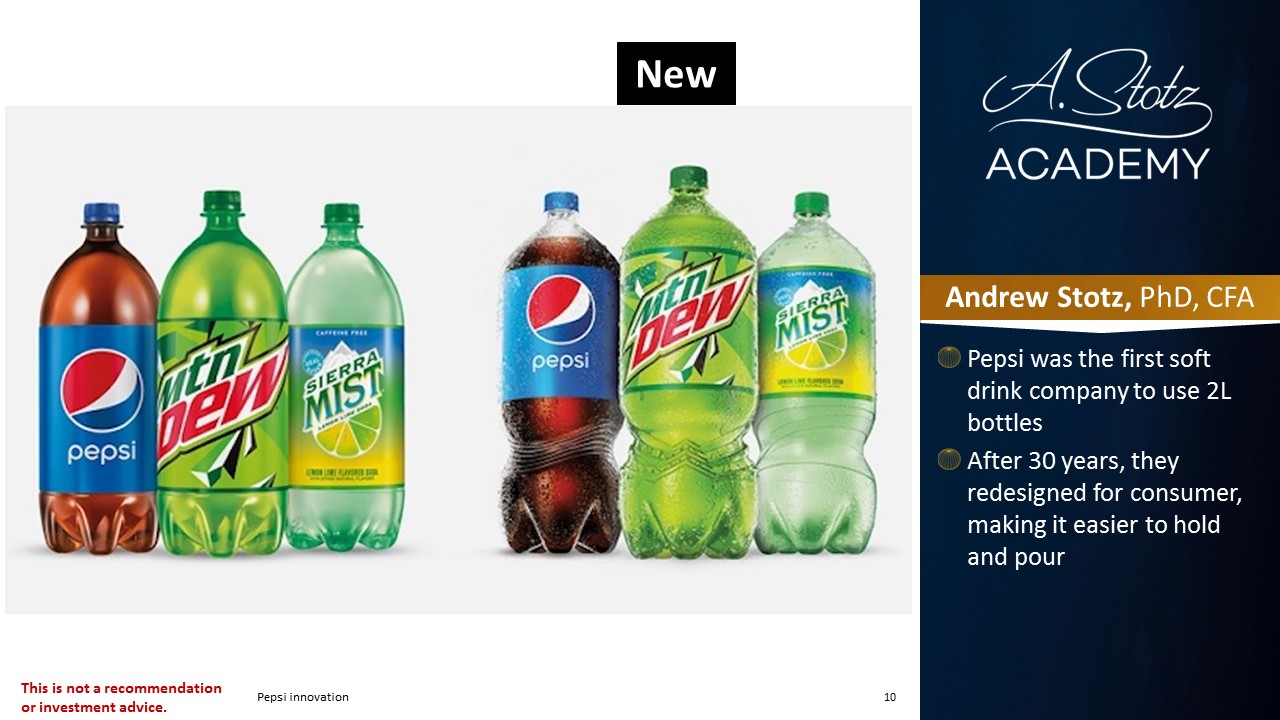
- Pepsi was the first soft drink company to use 2L bottles
- After 30 years, they redesigned it for consumers, making it easier to hold and pour
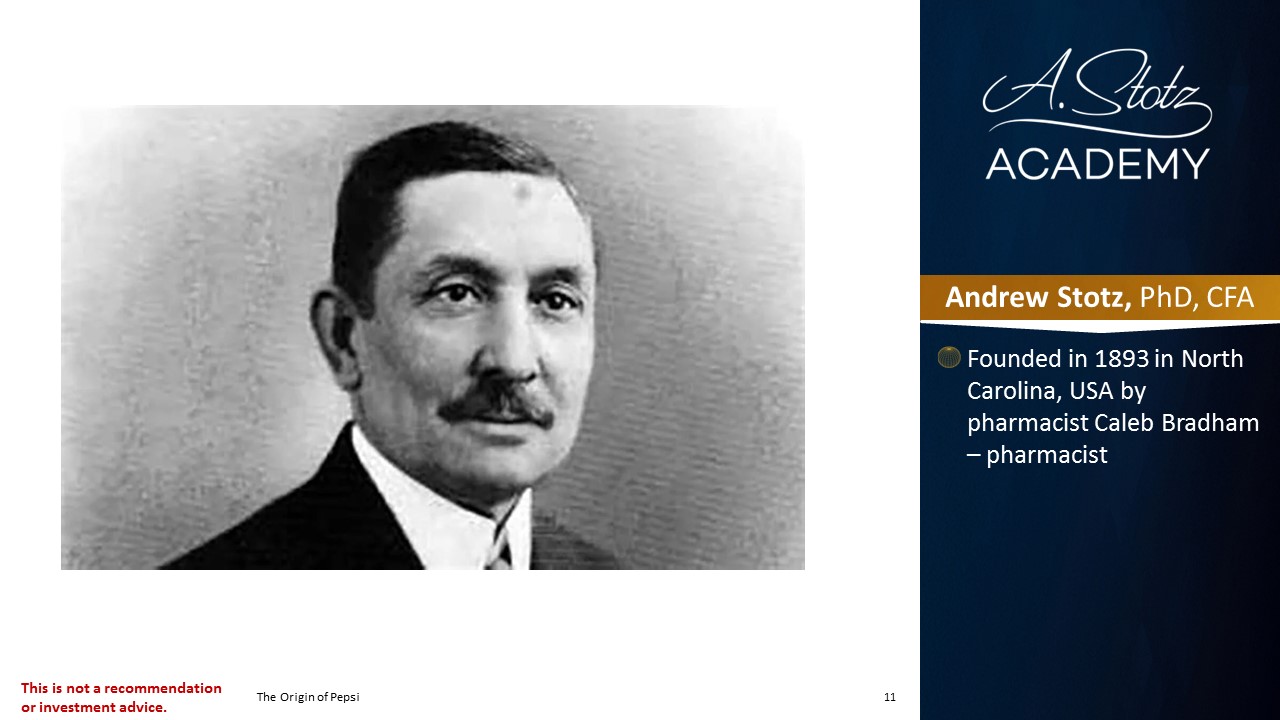
- Founded in 1893 in North Carolina, USA by pharmacist Caleb Bradham – pharmacist
Indra Nooyi
- Joined PepsiCo in 1994
- 1996 to 2000 was senior vice president for corporate strategy and development
- President and chief financial officer from 2001
- CEO from 2006 to 2018
- Chairwoman from 2007 until 2019
Its competitive advantage: Competitive advantage through a wide product portfolio of popular beverage, snack, and food brands.
How it achieved its competitive advantage: Achieved its competitive advantage through strong brand recognition, diverse product offerings, and effective marketing strategies.
Quarterly Results
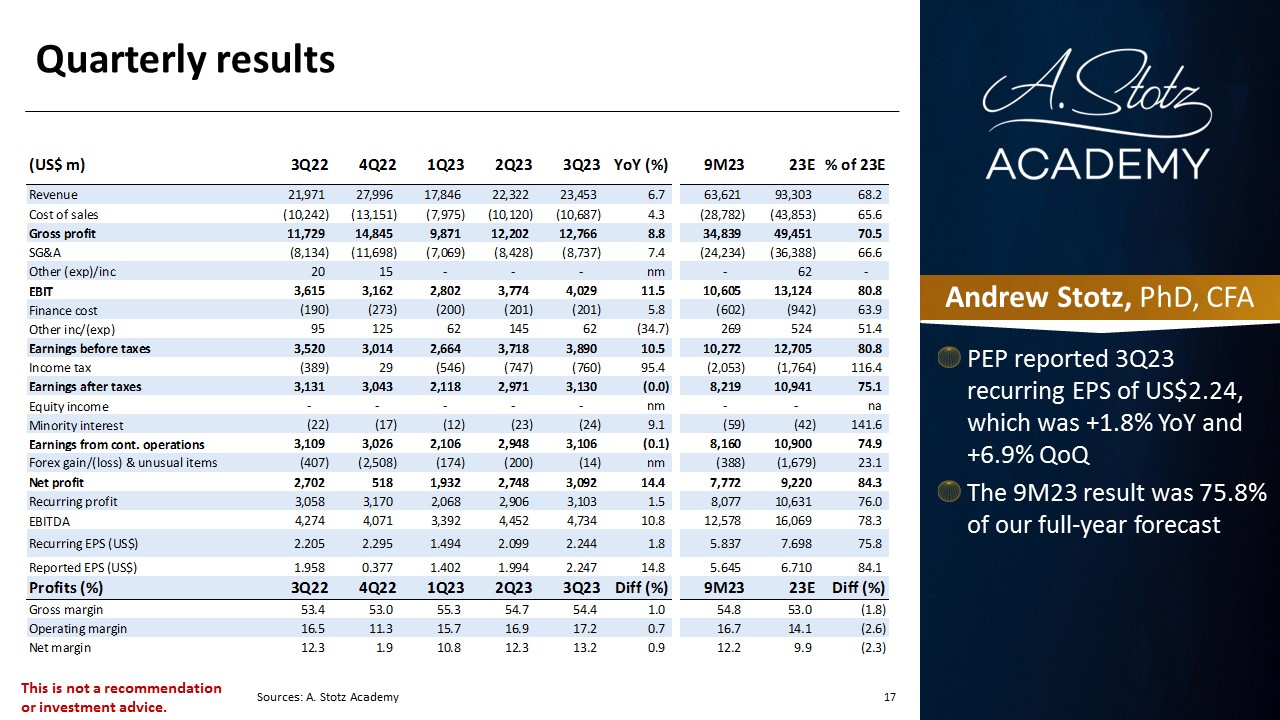
- PEP reported 3Q23 recurring EPS of US$2.24, which was +1.8% YoY and +6.9% QoQ
- The 9M23 result was 75.8% of our full-year forecast
Updated Financial Performance (FY2024)
PepsiCo’s full-year 2024 results showed the scale of its diversified business model:
- Total revenue: $91.9 billion (up 0.4% year-over-year)
- Operating profit: $12.9 billion (up 8% year-over-year)
- Net income: $9.6 billion (net margin of 10.4%)
- Organic revenue growth: 1.3%, driven primarily by pricing
While revenue growth was modest, PepsiCo’s operating profit improvement reflected disciplined cost management and pricing power across both its food and beverage portfolios. However, volume softness in North America, particularly in Frito-Lay and Quaker Foods, signaled that consumers were pushing back on price increases.
For context, Coca-Cola’s net income in FY2024 was $10.6 billion, meaning Coca-Cola generated more total profit than PepsiCo despite having roughly half the revenue. This is the clearest illustration of why profit margins matter more than revenue size when analyzing a company’s profitability.
What Does PepsiCo Own?
PepsiCo is far more than a soda company. It operates one of the world’s largest food-and-beverage portfolios with 23 brands that each generate more than $1 billion in annual retail sales. Understanding what PepsiCo owns explains both its massive revenue base and its lower margins compared to Coca-Cola.
PepsiCo’s Major Business Segments
| Segment | Key Brands | FY2024 Revenue Share | Operating Profit Share |
|---|---|---|---|
| Frito-Lay North America | Lay’s, Doritos, Cheetos, Tostitos, Ruffles, Fritos | ~27% | ~43% |
| PepsiCo Beverages North America | Pepsi, Mountain Dew, Gatorade, Aquafina, Starry | ~32% | ~15% |
| Quaker Foods North America | Quaker Oats, Cap’n Crunch, Life, Rice-A-Roni | ~3.4% | ~2% |
| International (Latin America, Europe, AMESA, APAC) | All brands above + regional products | ~37.6% | ~40% |
Key Brands by Category
Snacks & Foods:
- Frito-Lay: Lay’s, Doritos, Cheetos, Tostitos, Ruffles, Fritos, Sun Chips, Smartfood
- Quaker Foods: Quaker Oats, Cap’n Crunch, Life cereal, Rice-A-Roni, Aunt Jemima/Pearl Milling Company
- Recent acquisition: Siete Foods (completed January 2025 for $1.2 billion)
Beverages:
- Carbonated: Pepsi, Mountain Dew, Sierra Mist/Starry, Mirinda, 7UP (international)
- Sports & Energy: Gatorade, Rockstar Energy
- Water & Other: Aquafina, Bubly sparkling water, Lipton (partnership)
- Recent acquisition: Poppi (prebiotic soda, announced March 2025 for $1.6 billion)
Notable divestiture: PepsiCo sold a majority stake in Tropicana and Naked juice brands to PAI Partners in 2021 for $3.3 billion, retaining a 39% stake.
The sheer breadth of this portfolio is why PepsiCo’s revenue is nearly double Coca-Cola’s. But snack foods and finished beverages carry lower margins than Coca-Cola’s concentrate model, which is the fundamental reason PepsiCo’s profit margin trails Coca-Cola’s.
Does Coca-Cola Own Pepsi?
No. Coca-Cola and PepsiCo are completely separate, publicly traded companies that have been direct competitors for over 100 years. Coca-Cola (NYSE: KO) is headquartered in Atlanta, Georgia. PepsiCo (NASDAQ: PEP) is headquartered in Purchase, New York. They share no ownership, no parent company, and no board overlap.
The confusion is understandable given how dominant both brands are in the beverage industry. In the US carbonated soft drink market, Coca-Cola holds approximately 44% market share versus PepsiCo’s approximately 24%. But outside of carbonated drinks, PepsiCo’s business extends far beyond beverages into snacks and foods, a territory where Coca-Cola does not compete at all.
For a deep dive into how Coca-Cola’s concentrate-based business model works, see our companion analysis: Coca-Cola Valuation: What Drives Revenue (It’s Not Soda).
Why Is PepsiCo’s Profit Margin Lower Than Coca-Cola’s?
The margin gap between PepsiCo (~10% net margin) and Coca-Cola (~23% net margin) is not a sign of poor management; it reflects fundamentally different business models.
1. Coca-Cola’s Concentrate Model vs PepsiCo’s Integrated Model
Coca-Cola operates primarily as a concentrate seller. It manufactures flavored syrups and sells them to independent bottling partners who handle mixing, packaging, and distribution. This model produces gross margins of 60-80% on concentrates because Coca-Cola avoids the capital-intensive costs of water, packaging, trucking, and retail distribution.
PepsiCo, by contrast, manufactures and distributes many of its own products. Frito-Lay operates its own snack manufacturing plants, delivery fleets, and direct-store-delivery (DSD) routes. PepsiCo Beverages North America handles a larger share of finished beverage production than Coca-Cola’s system does. These operations require significant capital expenditure and operating costs, pulling margins lower.
2. Snack Foods Carry Different Margin Structures
While Frito-Lay is PepsiCo’s most profitable segment (43% of operating profit from 27% of revenue), snack food margins are structurally lower than concentrate margins. Raw materials (potatoes, corn, vegetable oil), manufacturing, and the extensive DSD distribution network all add cost layers that concentrate-based beverage companies avoid.
3. Product Mix and Revenue Composition
Approximately 55% of PepsiCo’s revenue comes from food and snacks, while 45% comes from beverages. This mix means PepsiCo’s blended margin reflects the weighted average of food operations (moderate margins) and beverage operations (higher margins but still below Coca-Cola’s concentrate model).
4. Scale vs Margin Trade-Off
PepsiCo’s diversification gives it nearly $92 billion in revenue, almost double Coca-Cola’s. This diversification provides resilience: when beverage volumes decline, snack sales can offset the weakness (and vice versa). From a valuation perspective, the question is whether PepsiCo’s revenue diversification and resilience justify a lower margin profile, or whether Coca-Cola’s higher margins and pricing power make it the stronger value creator.
Ready to advance?
The Advancer Program helps mid-career professionals sharpen their valuation and equity research skills and stand out for promotions or lateral moves into investment roles.
How Do Investors Choose Between PepsiCo and Coca-Cola?
The PepsiCo vs Coca-Cola comparison is one of the most debated in equity analysis. Here’s how professional analysts typically frame it using different valuation methods:
- Dividend investors tend to favor Coca-Cola. With 60+ consecutive years of dividend increases, a ~3% yield, and a payout ratio supported by high margins, KO is a classic income stock. Warren Buffett’s Berkshire Hathaway has held Coca-Cola since 1988, a position worth over $25 billion.
- Growth-seeking investors sometimes prefer PepsiCo. The Frito-Lay snack business has stronger organic growth potential than carbonated soft drinks, and PepsiCo’s recent acquisitions (Siete Foods, Poppi) signal a strategy to capture emerging consumer trends.
- DCF analysts need to model each company differently. Coca-Cola’s stable cash flows make it a natural Dividend Discount Model candidate. PepsiCo’s more complex segment structure may call for a sum-of-the-parts approach or a Free Cash Flow to the Firm (FCFF) model that captures its higher capital intensity.
Both companies compete in the same market but offer investors fundamentally different risk/return profiles. Understanding the margin difference is the starting point for any serious comparative valuation.
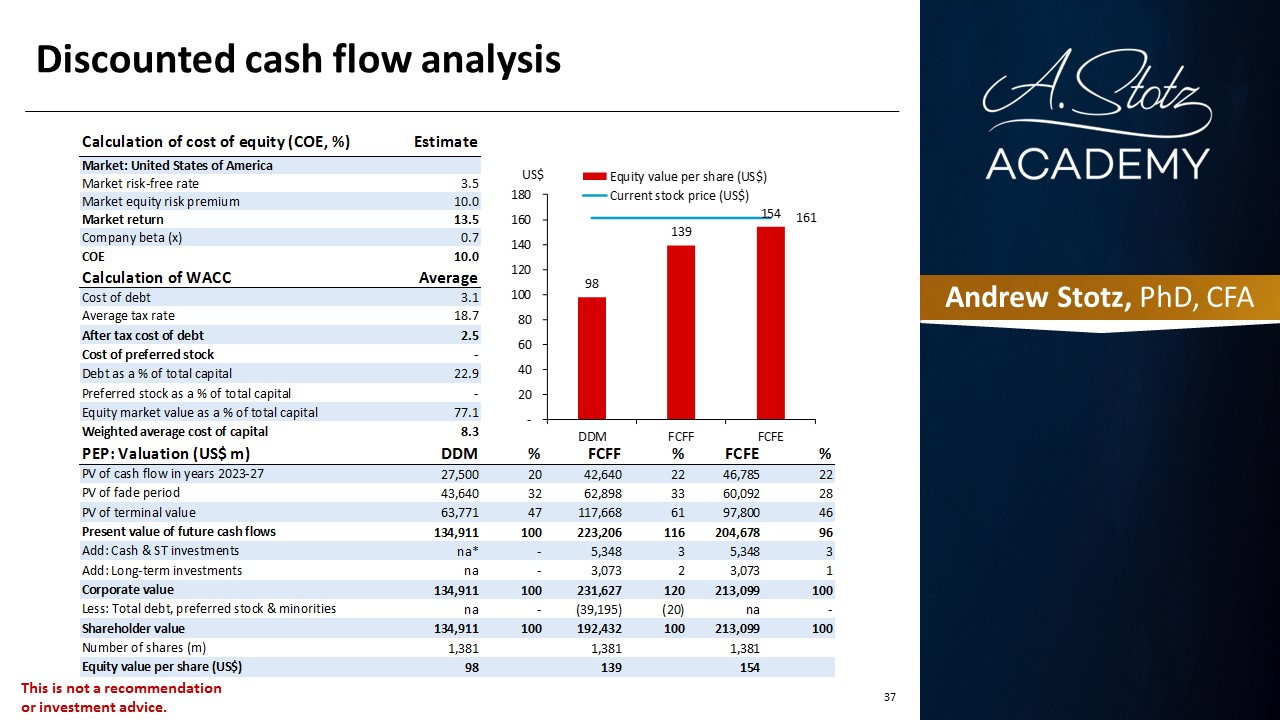
Valuation
DISCLAIMER: This content is for information purposes only. It is not intended to be investment advice. Readers should not consider statements made by the author(s) as formal recommendations and should consult their financial advisor before making any investment decisions. While the information provided is believed to be accurate, it may include errors or inaccuracies. The author(s) cannot be held liable for any actions taken as a result of reading this article.
Switching into finance from another field?
Our Switcher Program is designed for career changers who need to build credibility fast — no finance background required.
Frequently Asked Questions About PepsiCo and Coca-Cola
Does Coca-Cola own Pepsi?
No. Coca-Cola (NYSE: KO) and PepsiCo (NASDAQ: PEP) are entirely separate, publicly traded companies. They have been direct competitors in the global beverage market for over 100 years. Coca-Cola is headquartered in Atlanta, Georgia, while PepsiCo is based in Purchase, New York. They share no ownership, board members, or parent company. Coca-Cola holds approximately 44% of the US carbonated soft drink market, compared to PepsiCo’s approximately 24%.
What does PepsiCo own?
PepsiCo owns 23 brands that each generate over $1 billion in annual retail sales. Major brands include Lay’s, Doritos, Cheetos, and Tostitos (via Frito-Lay), Pepsi, Mountain Dew, Gatorade, and Aquafina (beverages), and Quaker Oats, Cap’n Crunch, and Life cereal (Quaker Foods). PepsiCo sold its Tropicana juice business in 2021 and recently acquired Siete Foods (2025) and Poppi prebiotic soda (2025).
What is PepsiCo’s profit margin?
PepsiCo’s net profit margin was approximately 10.4% in fiscal year 2024, based on $9.6 billion in net income on $91.9 billion in revenue. Its gross margin was approximately 54.6%. Both figures are lower than Coca-Cola’s corresponding margins (22.6% net, 61.1% gross) because PepsiCo operates capital-intensive snack food manufacturing and distribution in addition to beverages.
What is Coca-Cola’s profit margin?
Coca-Cola’s net profit margin was approximately 22.6% in fiscal year 2024, with net income of $10.6 billion on $47.7 billion in revenue. Coca-Cola’s higher margins reflect its asset-light concentrate model, where the company sells flavored syrups to bottling partners rather than manufacturing and distributing finished beverages. For a deeper analysis, see our article: For Every Dollar of Coca-Cola You Buy, a Quarter Goes to Profit.
How much revenue does Coca-Cola make per day?
Based on Coca-Cola’s trailing twelve-month revenue of approximately $47.7 billion, the company generates roughly $131 million per day. Coca-Cola sells approximately 2.2 billion servings of beverages daily across more than 200 countries and 500+ brands. For a complete breakdown of Coca-Cola’s revenue model, see our analysis: What Drives Coca-Cola’s Revenue, It’s Not Soda.
Is Coca-Cola or PepsiCo a better investment?
It depends on what you’re optimizing for. Coca-Cola offers higher margins (~23% net), a 60+ year dividend growth streak, and a simpler business model ideal for income-focused investors. PepsiCo offers greater revenue diversification ($92B vs $48B), exposure to the growing snack food category through Frito-Lay, and a lower P/E ratio (~22x vs ~26x). Professional analysts typically model both using different valuation approaches to determine which offers better risk-adjusted returns.
Where can I learn to value companies like PepsiCo and Coca-Cola?
The Valuation Master Class Boot Camp teaches you to build complete financial models using real company data. You’ll learn to analyze revenue segments, calculate margins, build DCF models, and present investment theses, the same skills used by professional equity analysts. The program is designed for career starters, mid-career advancers, and career switchers who want to learn business valuation course fundamentals through hands-on practice.
Ready to Take the Next Step?
Join 5,000+ finance professionals who’ve leveled up with Valuation Master Class.