Sector specific issues

All industry related issues regarding your forecast
Common-sized P&L and Balance Sheet data will help you put your forecast into perspective regarding sector competitors
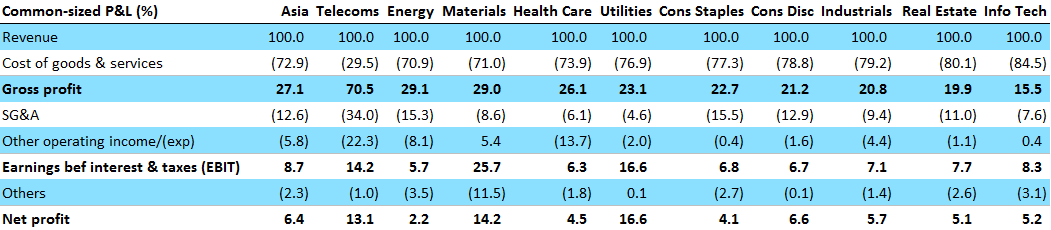
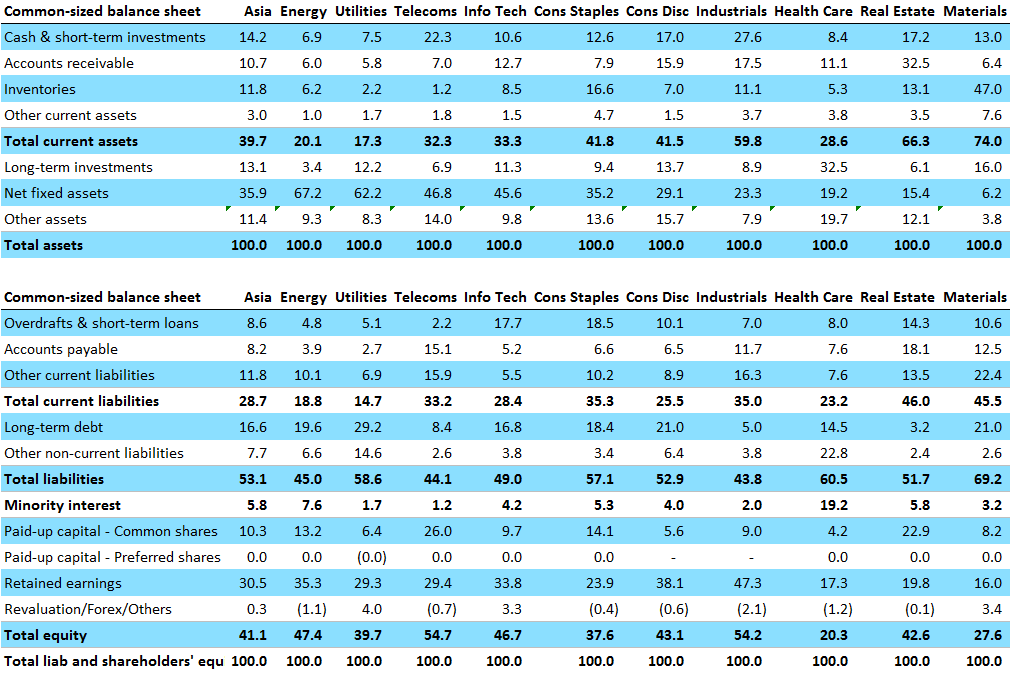
Data as of 2015.
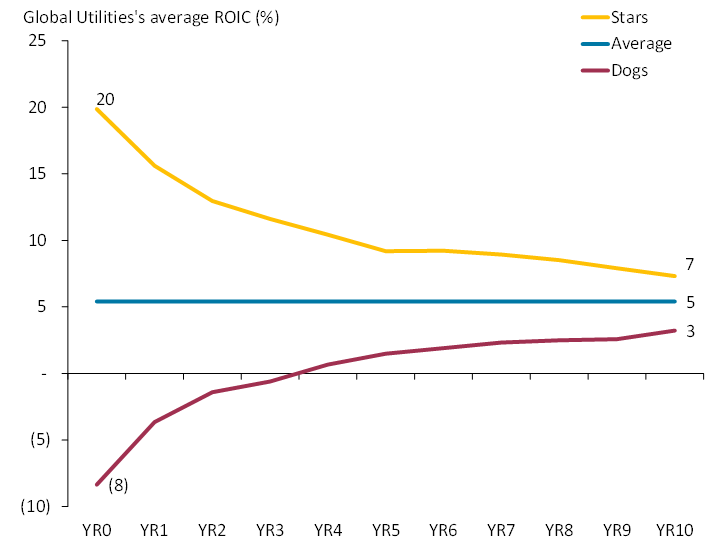
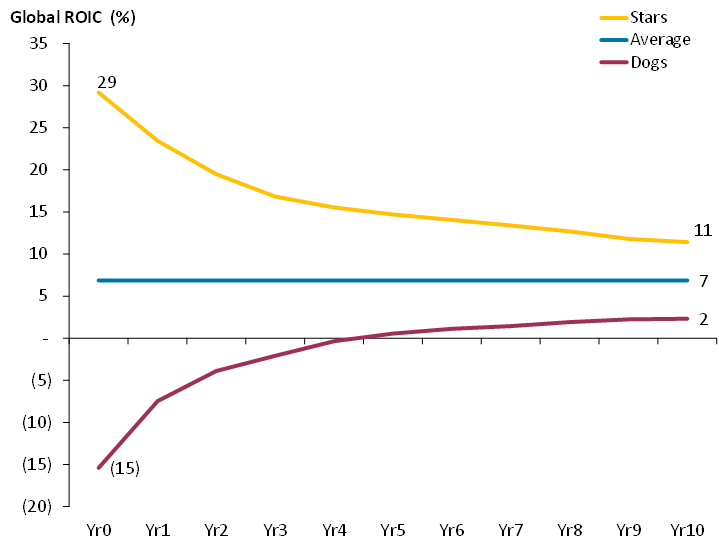
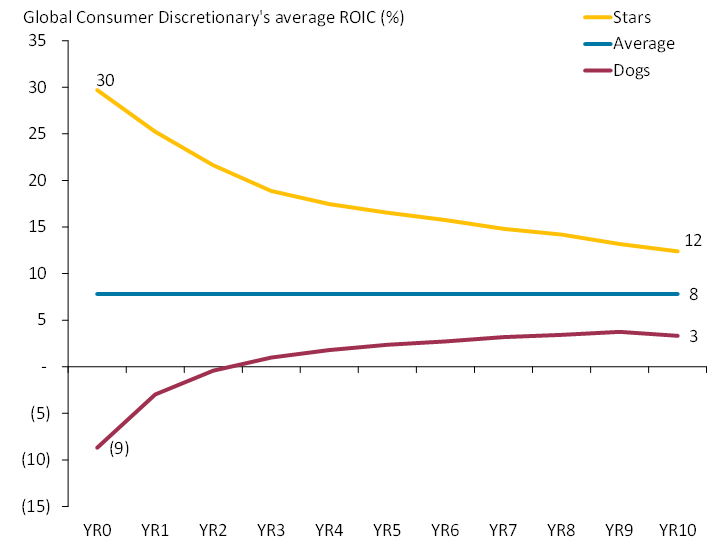
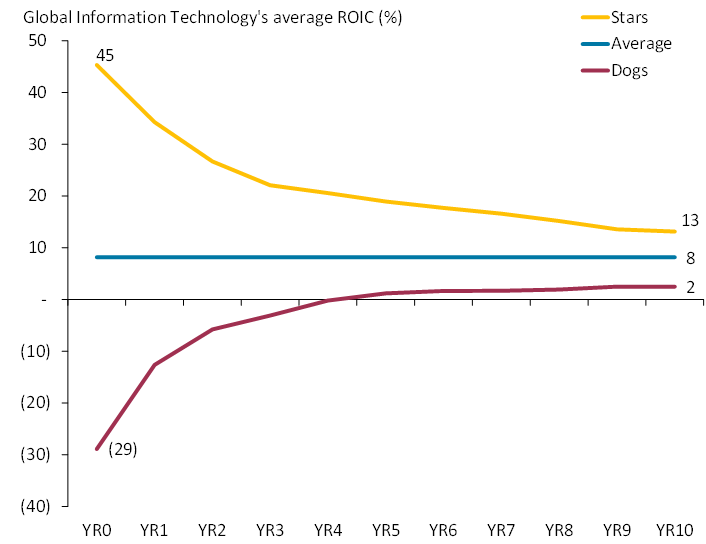
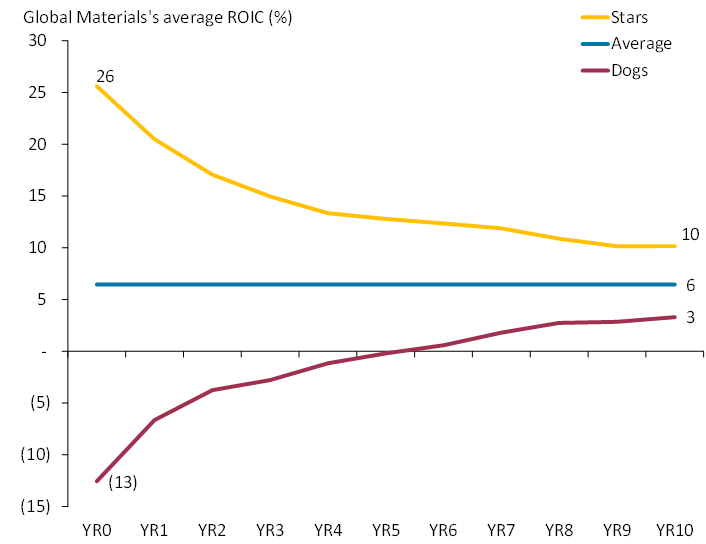
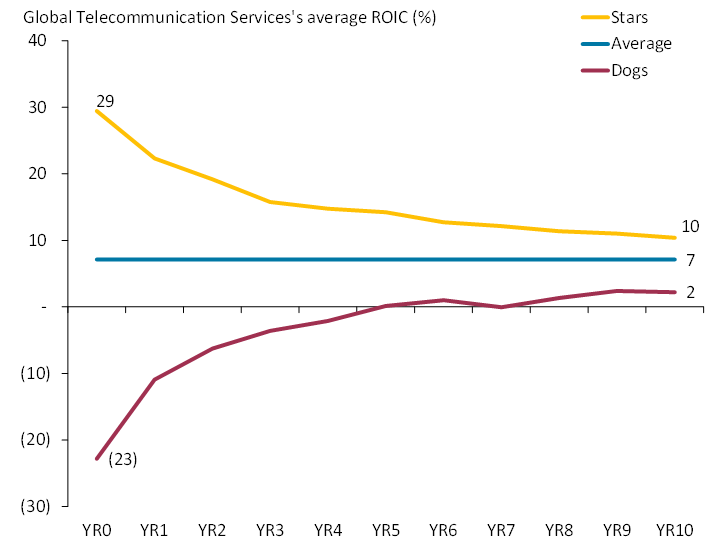
ROIC
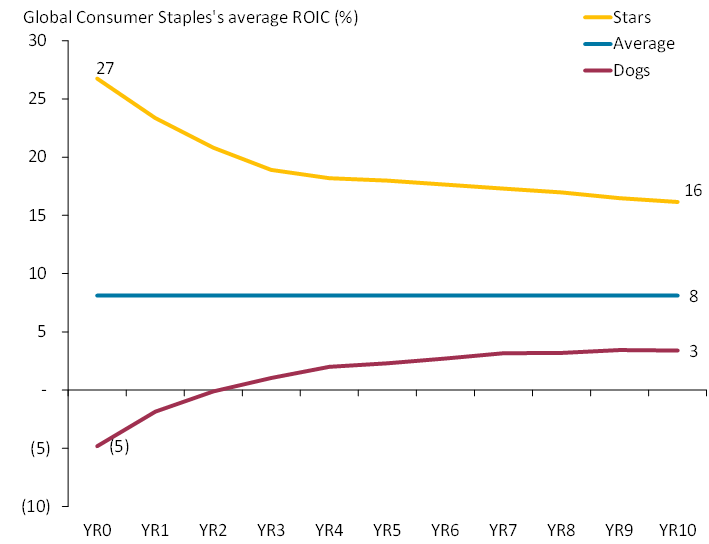
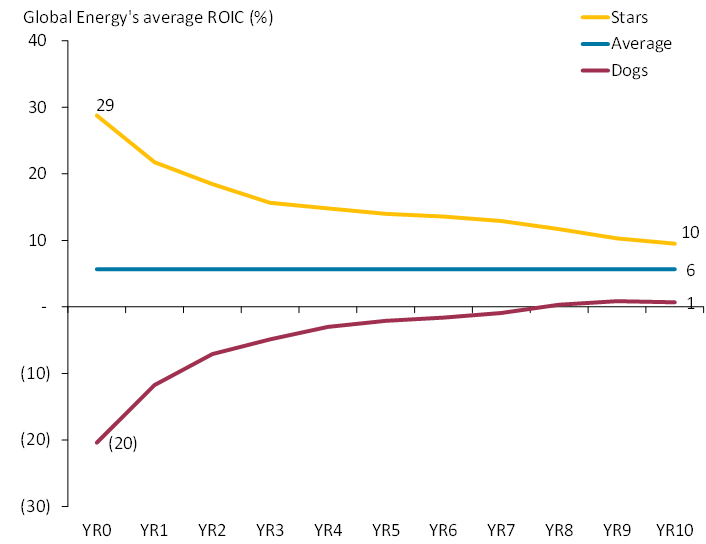
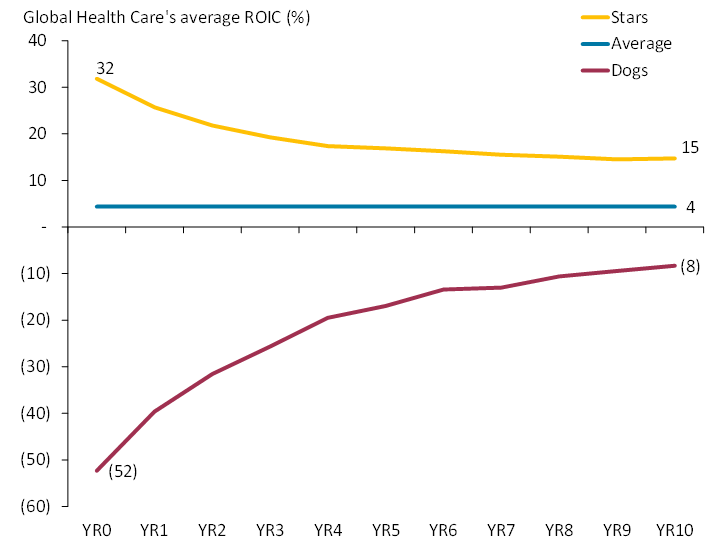
We analyzed almost 13.000 companies (from a universe of 26.000 companies) in 10 sectors all over the world to understand the development of ROIC over time. The decay analysis was performed by sorting firms into deciles and tracking the average ROIC for those ten portfolios. The findings are essential for valuation as one option of dealing with the fade and terminal period is to fade profitability. Our results confirm the effectiveness of the ValueModel where profitability can be faded either to WACC or to WACC-20% discount or WACC+20% premium respectively. Additionally, it helps to put the profitability of firms into perspective which is useful in forecasting.
The main takeaway is that ‘Stars’ tend to stay ‘Stars’ and ‘Dogs’ tend to stay ‘Dogs’ even tho there is a clear trend for mean reversion for both groups.
1. Consumer Discretionary
2. Consumer Staples
3. Energy
4. Health Care
5. Industrials

6. Information Technology
7. Materials
8. Real Estate

9. Telecommunication Services
10. Utilities