Tesla Valuation: Is Tesla Overvalued? A DCF Case Study
What Is Tesla Worth? A Valuation Overview
Tesla (NASDAQ: TSLA) is one of the most debated stocks in the market. Based on our DCF valuation analysis, Tesla’s intrinsic value is approximately US$139 per share, using a WACC of 10.6% and a terminal growth rate of 5%. At its current market price, that implies significant downside, making Tesla a SELL in our framework.
But valuation is never a single number. Tesla’s stock price reflects not just the automotive business but investor expectations around energy storage, autonomous driving, and robotics. Whether Tesla is overvalued depends entirely on which assumptions you believe.
This case study walks through a complete Tesla valuation using the same methodology taught in the Valuation Master Class. We cover Tesla’s business segments, revenue drivers, DCF model assumptions, key risks, and what the bull and bear cases look like.
| Metric | Value |
|---|---|
| Ticker | TSLA (NASDAQ) |
| Rating | SELL |
| DCF Target Price | US$139 |
| WACC | 10.6% |
| Terminal Growth Rate | 5% |
| Valuation Method | FCFF (Free Cash Flow to Firm) |
Starting your finance career?
Our Starter Program gives you the foundational skills to land your first analyst role — DCF valuation, financial modeling, and interview prep included.
Our research shows that Tesla, Inc. is a SELL based on a target price of US$139, implying a downside of 31%. We derive our target price from a DCF-based valuation using a WACC of 10.6% and a terminal growth rate of 5%.
Highlights:
- The growing autonomous cars market is a revenue growth catalyst
- The new Redwood model could offset the Cybertruck’s potential setbacks
- The energy segment could transform into a major revenue source
Risks: Delays in launching and ramping up production, Supply shortages could harm Tesla’s production, High reliance on suppliers for lithium-ion battery cells, Full self-driving may get banned by law.
Background: Tesla, Inc. is an American electric vehicle (EV) and clean energy company founded in 2003. Specializes in EVs, battery products, and clean energy technologies. It operates in 2 main segments: Automotive and Energy, with the former currently the main revenue source.
The company manufactures and sells a range of vehicles, including the Model Y, Model 3, Model X, etc. Model 3 and Y are the best-selling cars, with around 96% of 2023 revenues.
Tesla holds around 19% share of the global BEVs market as of 2023, selling around 1.8m cars. The carmaker serves many countries, but mainly the US and China.
Who Owns Tesla?
Tesla, Inc. was founded in 2003 by Martin Eberhard and Marc Tarpenning. Elon Musk joined as the largest investor in 2004, contributing over $30 million in Tesla’s Series A funding round, and became chairman of the board. Musk assumed the role of CEO in 2008 and has led the company since.
As of 2026, Elon Musk remains Tesla’s CEO and largest individual shareholder, with an ownership stake of approximately 13% of outstanding shares. Institutional investors, including Vanguard, BlackRock, and State Street, collectively hold a significant majority of Tesla’s shares.
Understanding Tesla’s ownership structure matters for valuation because Musk’s involvement carries both a premium (visionary leadership, brand power) and a discount (key-man risk, political controversy, distraction across multiple ventures, including SpaceX, xAI, and government roles).
The Growing Autonomous Cars Market Is a Revenue Growth Catalyst
The global autonomous car market is expected to experience significant growth, with projections indicating a rise from US$1.6bn in 2022 to US$20bn by 2029, according to Fortune Business Insights. Tesla, a prominent player in this market, offers its autonomous driving system called Tesla Autopilot. In 2023, Tesla’s Model 3 and Model Y, both offering Autopilot capabilities, accounted for 96% of the company’s automotive sales and were the top-selling electric vehicles worldwide. With this strong market presence as the first mover and the projected growth of the global autonomous car market, we expect Tesla to achieve high double-digit revenue growth in the next 5 years.
The New Redwood Model Could Offset the Cybertruck’s Potential Setbacks
Tesla plans to launch a new car model called Redwood in the second half of 2025. Priced at around US$25K, it is expected to be highly sought-after due to its affordability. However, the production of Redwood may require Tesla to reallocate resources, potentially impacting the production of their leading models, Model 3 and Model Y. Still, we think they will be able to handle that. Tesla has not disclosed Cybertruck deliveries or commented on production volumes, suggesting that the Cybertruck may not have performed as expected. Hence, we anticipate that the Redwood model could generate positive results from 2025 onwards, offsetting potential bad results from the costly Cybertruck.
The Energy Segment Could Transform Into a Major Revenue Source
According to Precedence Research, the global energy storage market is projected to reach around US$170bn by 2032 (a CAGR of 14%). Tesla’s energy generation and storage (EGS) business contributed 6% to the company’s revenue in 2023. The EGS revenue grew by 54% YoY, driven by the deployment of the Megapack energy storage product, which reached 14.7 GWh, a 125% YoY rise. Megapack is a large-scale, lithium-based battery energy storage designed by Tesla to boost the stability of power grids and avoid outages. Each unit boasts a storage capacity of over 3 MWh, enough to power 3,600 homes for an hour. Also, McKinsey projected world li-on battery demand to grow by 27% yearly to reach 4,700 GWh by 2030 from 700 GWh in 2022, driven by China, the US, and Europe. So, we see this segment as a great growth opportunity for Tesla in the upcoming years.
How Do You Value Tesla Using a DCF Model?
Valuing Tesla requires a discounted cash flow (DCF) model because traditional multiples (P/E, EV/EBITDA) are distorted by Tesla’s growth profile. Here is the step-by-step approach used in this case study:
Step 1: Project Revenue Growth
Our base case assumes sales growth of approximately 21% annually through 2028, driven by:
- Continued Model Y/3 volume growth in existing markets
- New model launches (including the next-generation “Redwood” platform)
- Energy storage revenue growth (Megapack backlog)
| Scenario | Sales Growth (to 2028E) | Target Price |
|---|---|---|
| Optimistic | 22.7% | US$142 |
| Base Case | 21.0% | US$139 |
| Pessimistic | 18.5% | US$135 |
Step 2: Estimate Free Cash Flow to Firm (FCFF)
Tesla’s FCFF is calculated from operating earnings after accounting for capital expenditure (Tesla is investing heavily in new factories, the Cybertruck line, and battery manufacturing) and changes in working capital. Understanding the relationship between capex and depreciation is essential here; Tesla’s capex-to-depreciation ratio signals aggressive investment for future growth.
Step 3: Determine the Discount Rate (WACC)
We use a weighted average cost of capital (WACC) of 10.6% for Tesla. This reflects:
- Tesla’s equity beta (higher than the auto industry average due to stock volatility)
- A risk-free rate based on US Treasury yields
- Tesla’s relatively low debt load compared to traditional automakers
Step 4: Calculate Terminal Value
With a terminal growth rate of 5% (aggressive but justified by Tesla’s addressable market in energy and autonomy), the terminal value captures Tesla’s long-term cash flows beyond the explicit forecast period.
Step 5: Discount to Present Value
Discounting all projected FCFF and the terminal value back to today at 10.6% yields our target price of US$139.
For a deeper understanding of which valuation approach works best for companies like Tesla, see our guide on which valuation method is most suitable for different types of companies.
Ready to advance?
The Advancer Program helps mid-career professionals sharpen their valuation and equity research skills and stand out for promotions or lateral moves into investment roles.
The Automotive Industry Is Shifting to the Technology Era
China is a Promising Market for EVs
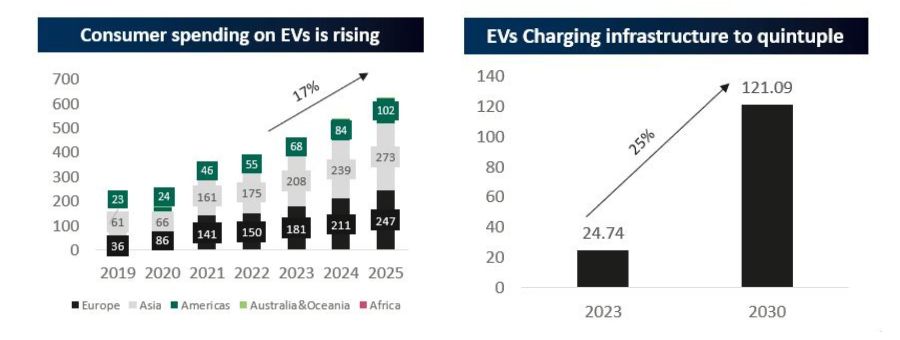
The automotive industry is shifting from hardware to software, emphasizing enhancing software functionalities and services. By 2025, consumer spending on EVs is expected to reach US$627bn, increasing by 17% compared to 2023. This dynamic has allowed new entrants in Europe and abroad, especially in China. Indeed, in 1Q23, China was by far the largest EV market with 55% of global EV sales, a total of 3.4m units. Moreover, thanks to China’s comprehensive supply chain advantages, low costs in logistics and labor, and beneficial policies promoting low-carbon vehicles, China is a competitive and crucial market for automotive manufacturers.
Technological and Infrastructure Enhancement Benefits Production Efficiency
The EV market is expanding due to technological advancements, government policy, and infrastructure support. According to the McKinsey Global Institute, the progress in robotics and AI technologies could potentially replace 30% to 60% of tasks in various occupations. This technological advancement helps to enhance manufacturing and supply chain efficiency. Additionally, the industry also benefits from infrastructure support. According to Grandview Research, the EV charging infrastructure market could reach US$121bn by 2030, growing at a 25% CAGR. These factors should foster the growth of EV production and sales.
Batteries Are the New Industry Control Points When EVs Become the Norm
More than a third of the value of a BEV is associated with the battery. China was the largest supplier of materials for the lithium-ion batteries used in Tesla’s EVs, based on Nikkei’s supply chain analysis. This means that increased geopolitical tensions between the US and China could eventually make it difficult for Tesla to buy batteries. Therefore, to mitigate the impact of geopolitical tensions, especially in Europe, automotive manufacturers need to diversify their inputs and production or put factories in areas where they sell products to customers to avoid supply chain disruption.
Tesla – Consensus Estimates
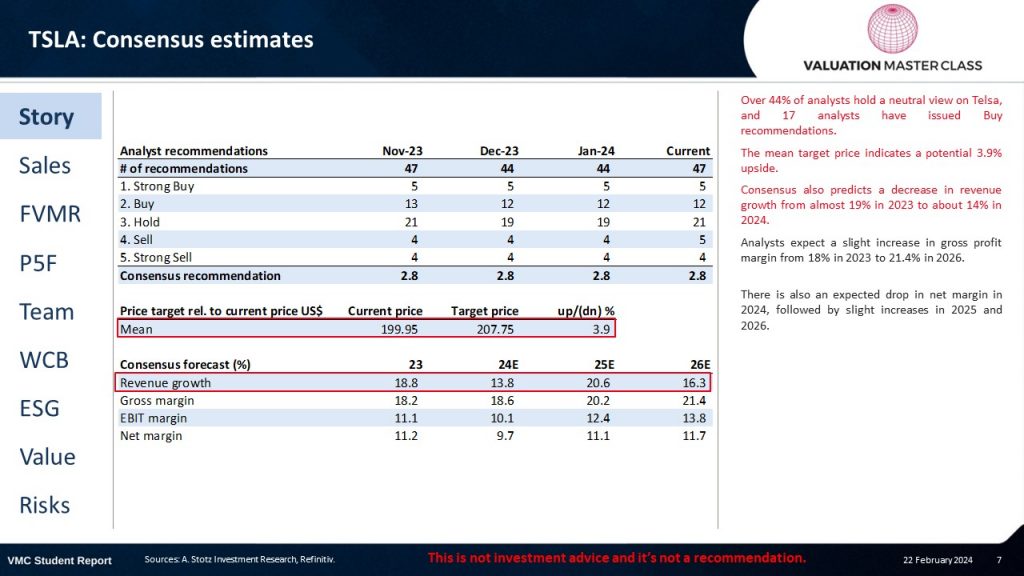
- Over 44% of analysts hold a neutral view on Tesla, and 17 analysts have issued Buy recommendations.
- The mean target price indicates a potential 3.9% upside.
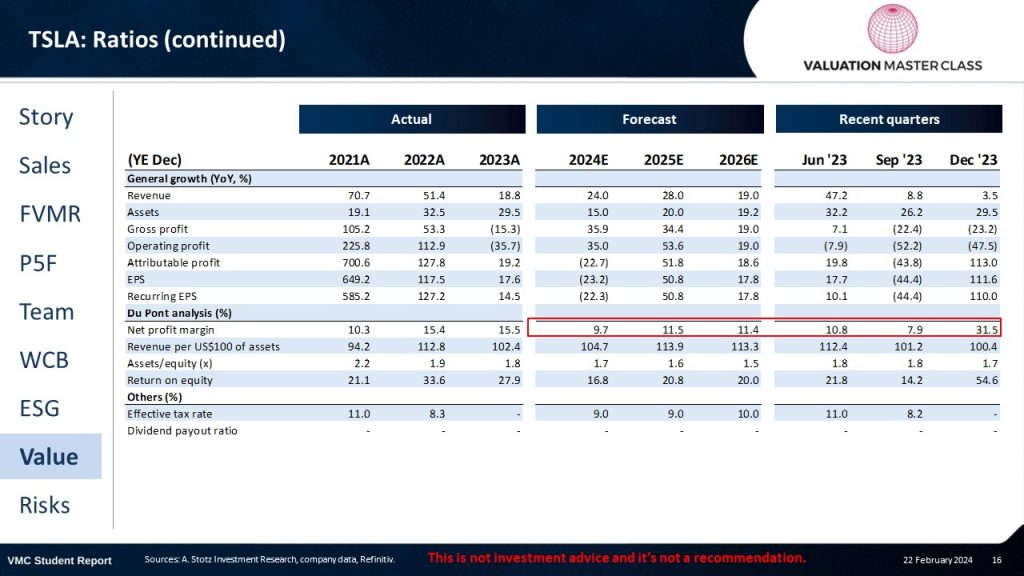
- Consensus also predicts a decrease in revenue growth from almost 19% in 2023 to about 14% in 2024.
- Analysts expect a slight increase in gross profit margin from 18% in 2023 to 21.4% in 2026.
- There is also an expected drop in net margin in 2024, followed by slight increases in 2025 and 2026.
Tesla – Revenue Breakdown
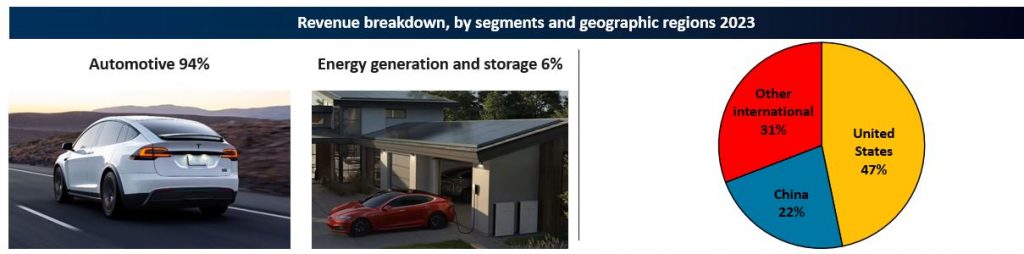
In 2023, Tesla reported a revenue of almost US$97bn, with the automotive segment contributing 94% of sales. Tesla offers four primary EV models, namely Model 3, Y, X, and S, targeting different customer segments. The energy segment accounted for 6% of revenue, driven by products such as Powerwall, Megapack, and solar energy solutions.
Tesla’s revenue is derived from various geographic regions, with the US, China, and other countries representing 47%, 22%, and 31% of total revenues in 2023, respectively. The company sold 1.8m cars that year, with production facilities located in the US, China, and Germany. Model 3 and Model Y were the best-selling models, contributing approximately 96% of the total revenues.
Tesla – A. Stotz Four Elements: FVMR
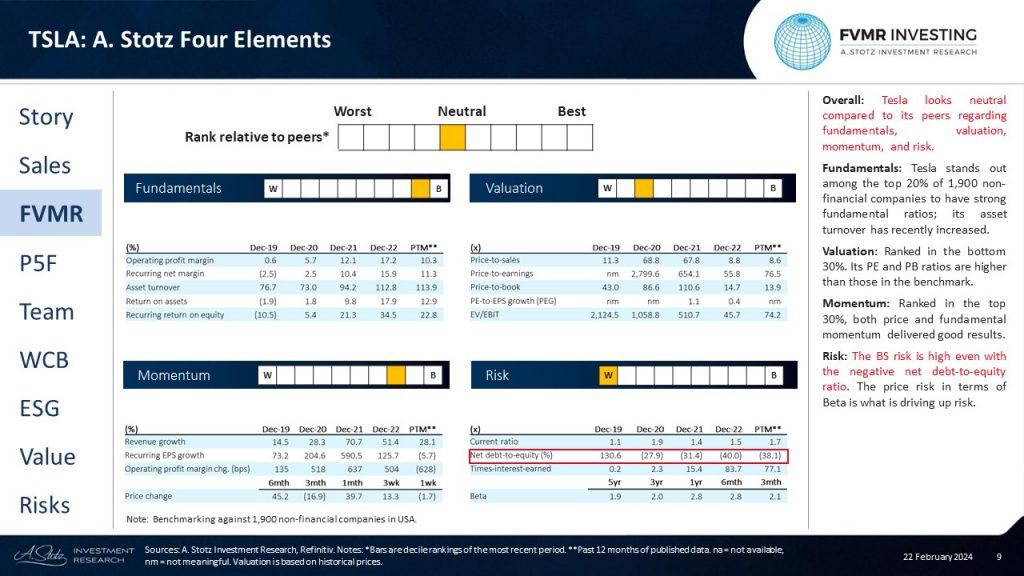
- Overall: Tesla looks neutral compared to its peers regarding fundamentals, valuation, momentum, and risk.
- Fundamentals: Tesla stands out among the top 20% of 1,900 non-financial companies to have strong fundamental ratios; its asset turnover has recently increased.
- Valuation: Ranked in the bottom 30%. Its PE and PB ratios are higher than those in the benchmark.
- Momentum: Ranked in the top 30%, both price and fundamental momentum delivered good results.
- Risk: The BS risk is high even with the negative net debt-to-equity ratio. The price risk in terms of Beta is what is driving up the risk.
Tesla – A. Stotz Profitable Growth: World Class Benchmarking
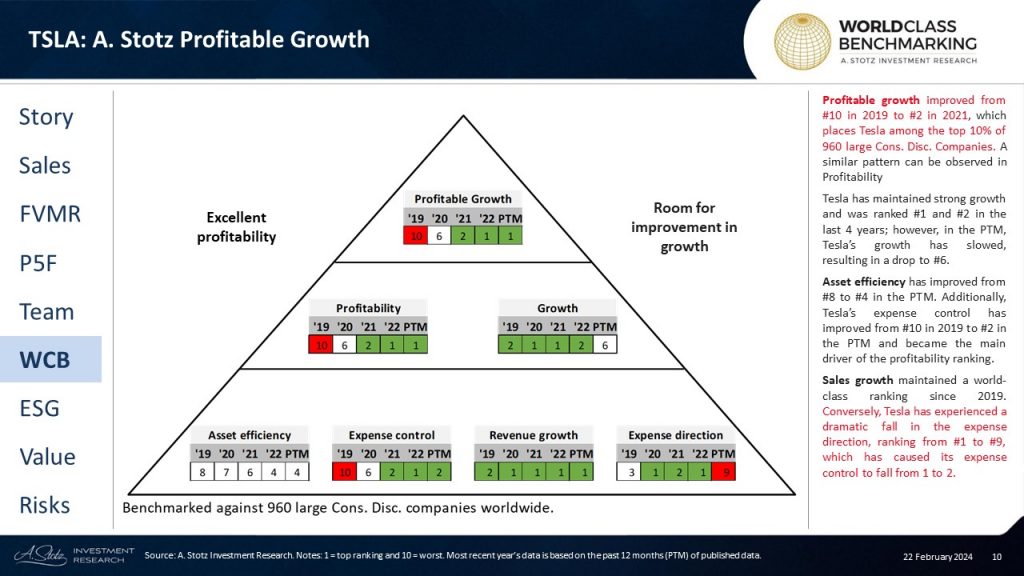
Profitable growth improved from #10 in 2019 to #2 in 2021, which places Tesla among the top 10% of 960 large Cons. Disc. Companies. A similar pattern can be observed in Profitability
Tesla has maintained strong growth and was ranked #1 and #2 in the last 4 years; however, in the PTM, Tesla’s growth has slowed, resulting in a drop to #6.
Asset efficiency has improved from #8 to #4 in the PTM. Additionally, Tesla’s expense control has improved from #10 in 2019 to #2 in the PTM and became the main driver of the profitability ranking.
Sales growth has maintained a world-class ranking since 2019. Conversely, Tesla has experienced a dramatic fall in the expense direction, ranking from #1 to #9, which has caused its expense control to fall from 1 to 2.
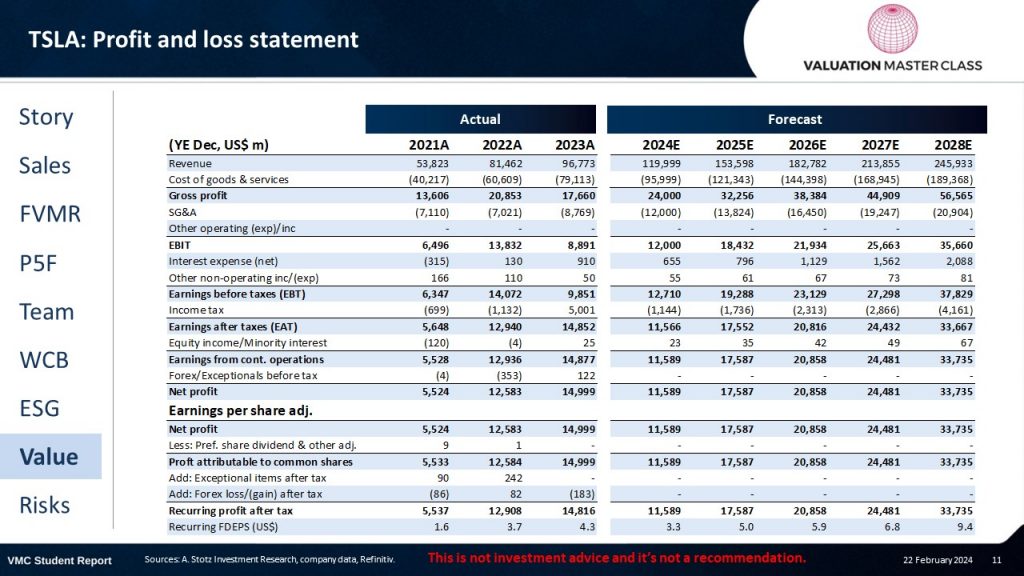
Tesla – Profit & Loss statement
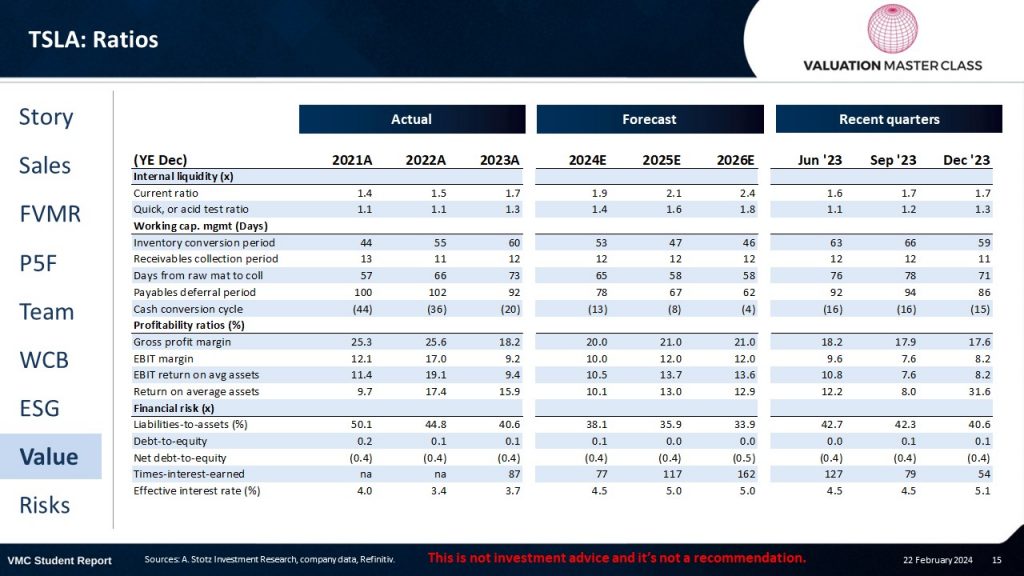
Tesla – Ratios
Tesla – Relative Valuation
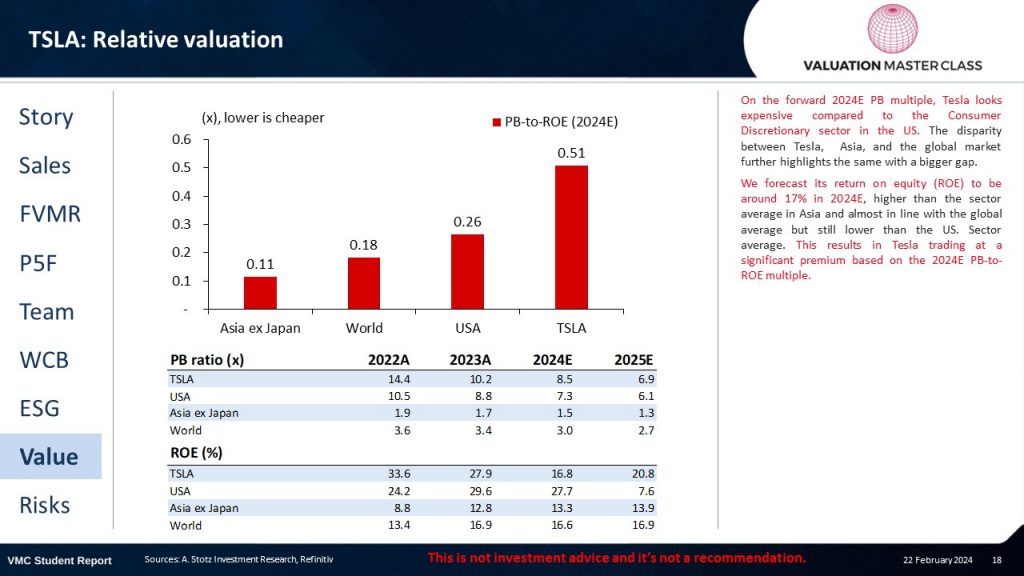
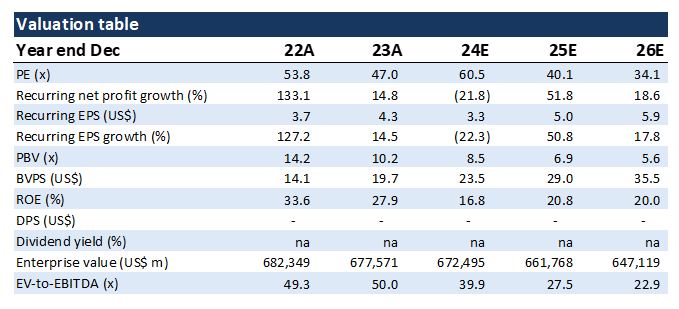
On the forward 2024E PB multiple, Tesla looks expensive compared to the Consumer Discretionary sector in the US. The disparity between Tesla, Asia, and the global market further highlights the same, with a bigger gap.
We forecast its return on equity (ROE) to be around 17% in 2024E, higher than the sector average in Asia and almost in line with the global average, but still lower than the US. Sector average. This results in Tesla trading at a significant premium based on the 2024E PB-to-ROE multiple.
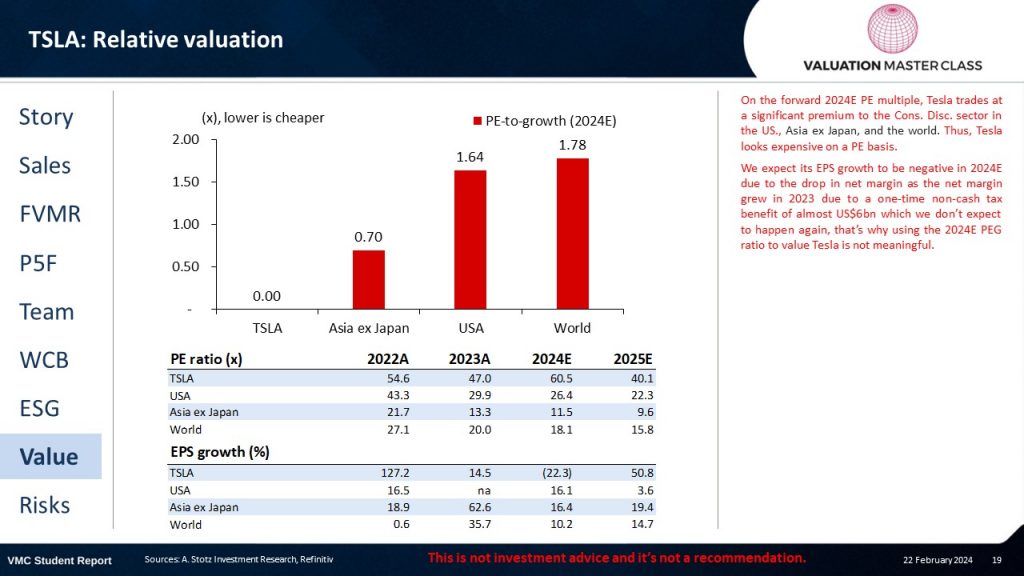
On the forward 2024E PE multiple, Tesla trades at a significant premium to the Cons. Disc. sector in the US., Asia ex Japan, and the world. Thus, Tesla looks expensive on a PE basis.
We expect its EPS growth to be negative in 2024E due to the drop in net margin, as the net margin grew in 2023 due to a one-time non-cash tax benefit of almost US$6bn, which we don’t expect to happen again; that’s why using the 2024E PEG ratio to value Tesla is not meaningful.
Tesla – Valuation and Target Price
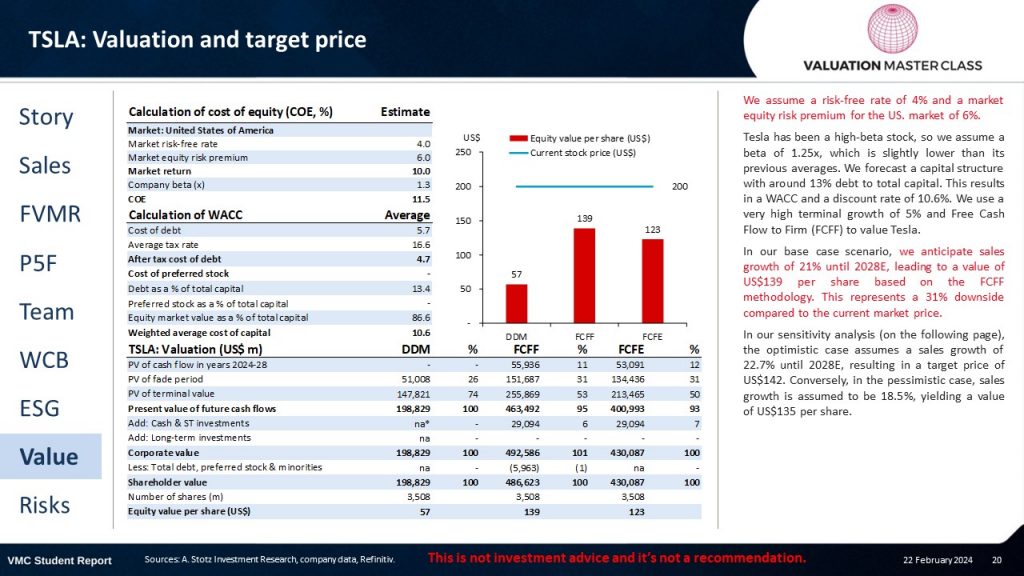
We assume a risk-free rate of 4% and a market equity risk premium for the US. market of 6%.
Tesla has been a high-beta stock, so we assume a beta of 1.25x, which is slightly lower than its previous averages. We forecast a capital structure with around 13% debt to total capital. This results in a WACC and a discount rate of 10.6%. We use a very high terminal growth of 5% and Free Cash Flow to Firm (FCFF) to value Tesla.
In our base case scenario, we anticipate sales growth of 21% until 2028E, leading to a value of US$139 per share based on the FCFF methodology. This represents a 31% downside compared to the current market price.
In our sensitivity analysis (on the following page), the optimistic case assumes a sales growth of 22.7% until 2028E, resulting in a target price of US$142. Conversely, in the pessimistic case, sales growth is assumed to be 18.5%, yielding a value of US$135 per share.
The Main Risk Is the Delay in Launching and Ramping up Production
1. Delays in Launching and Ramping up Production
Tesla’s business depends on how the company ramps up production to deliver products on time. Tesla has experienced and might also experience future delays in launching or ramping up production of the Redwood model, the Cybertruck, and some energy storage products in the future. Any delays could harm Tesla’s brand or the company’s ability to fulfill unearned revenue, therefore affecting operating results.
2. Supply Shortages Could Harm Tesla’s Production
Tesla’s supply chain, sourcing 1,000 parts from numerous suppliers, faces risks from external factors like material pricing, geopolitical events, or natural disasters. In 2021-2022, Tesla’s manufacturing costs were hugely affected by semiconductor shortages from Taiwan and China. Moreover, with the new global manufacturing facilities, Tesla may face issues due to the increased level of localized procurement. Inaccurate timing of component purchases and inadequate automation in supply chain management could lead to production disruptions and manufacturing cost overruns, harming the business results.
3. High Reliance on Suppliers for Lithium-ion Battery Cells
Tesla relies on suppliers such as Panasonic and Contemporary Amperex Technology Co. Limited (CATL) for battery cells and has limited flexibility in changing suppliers. Any disruption in the supply of battery cells from Tesla suppliers could limit the production of our vehicles and energy storage products. Moreover, the prices for these materials fluctuate, and their available supply may be unstable, which might incur unexpected production disruption, storage, transportation, and write-off costs, which may harm the business and the operating results.
4. Full Self-driving May Be Banned by Law
Although the software has various benefits, there are many safety concerns among users and the law. The overall fatal accident rate for auto travel, according to the NHTSA, was 1.35 deaths per 100m miles traveled in 2022. In other words, Tesla’s FSD system is likely ten times more dangerous at driving than humans. Many states are currently debating whether they should ban this technology. If they are banned, many new income streams would fail.
Is Tesla Overvalued? Bull vs. Bear Case
Whether Tesla is overvalued depends on which future you believe in. Here is a structured comparison:
| Factor | Bull Case | Bear Case |
|---|---|---|
| Automotive Volume | 6M+ vehicles by 2028 via new models and markets | Competition from BYD, VW, and legacy OEMs caps growth at 2–3M |
| Margins | Recovers to 20%+ via manufacturing efficiencies and FSD revenue | Stays below 18% due to price wars and competition |
| Energy Business | Becomes 20%+ of revenue by 2028, high-margin growth engine | Remains a small, capital-intensive segment |
| Autonomous Driving | FSD achieves Level 4, creates recurring software revenue stream | Regulatory delays and technical challenges keep FSD at Level 2+ |
| Robotics (Optimus) | Opens a trillion-dollar TAM in humanoid robots | Years from commercialization; optionality, not revenue |
| Valuation Multiple | Justified by TAM expansion across auto, energy, AI | Contracts as growth slows and competition intensifies |
Our assessment: At current prices, Tesla’s stock prices are in near-perfect execution across multiple business lines. Even our optimistic scenario (22.7% sales growth) yields a target of only US$142, suggesting the market is pricing in outcomes well beyond what the financials currently support.
Common Mistakes When Valuing Tesla
Valuing Tesla is one of the hardest exercises in equity research. Here are the most common errors analysts and investors make:
- Valuing Tesla as a tech company, not an automaker. Tesla manufactures physical products with capital-intensive factories, supply chains, and margin pressure. Applying SaaS-style multiples to an auto business leads to overvaluation.
- Ignoring competition from China. BYD has overtaken Tesla in global EV sales volume. Chinese manufacturers compete aggressively on price, and Tesla’s 19% global BEV market share is declining, not growing.
- Double-counting FSD and robotics revenue. Many analysts add optionality for Full Self-Driving and Optimus without discounting for execution risk, regulatory hurdles, and timeline uncertainty.
- Using too low a discount rate. Tesla’s stock is significantly more volatile than the market. Using a WACC below 10% understates the risk. Our 10.6% already accounts for Tesla’s above-average beta.
- Anchoring to past growth rates. Tesla grew from 500K to 1.8M units in three years. Extrapolating that growth indefinitely ignores the base effect; growing from 2M to 6M is structurally harder than from 500K to 1.8M.
Understanding return on invested capital (ROIC) is critical here. Tesla’s ROIC tells you whether the company is actually creating value with its massive capital investments, or simply growing revenue without generating adequate returns.
How Tesla Compares to Competitors
Tesla does not exist in a vacuum. Any credible valuation must account for competitive dynamics. Here is how Tesla compares to key rivals:
| Metric | Tesla | BYD | Toyota | VW Group |
|---|---|---|---|---|
| 2023 EV Deliveries | ~1.8M | ~3.0M | ~250K (BEV) | ~770K |
| Global BEV Market Share | ~19% | ~33% | ~3% | ~8% |
| Revenue (2023) | ~$97B | ~$85B | ~$275B | ~$295B |
| EV Strategy | Pure-play EV | EV + hybrid | Hybrid-first | Multi-brand EV |
| P/E Ratio (trailing) | ~70x | ~25x | ~10x | ~5x |
For a detailed comparison of how Toyota’s approach to EVs compares to Tesla’s, and how Mercedes-Benz is trying to close the technology gap with Tesla, see our companion case studies.
Tesla’s valuation premium over legacy automakers is justified only if you believe Tesla will maintain technology leadership AND expand into high-margin businesses (energy, FSD, robotics) that competitors cannot replicate. Our DCF suggests the current premium is excessive based on forecastable cash flows.
DISCLAIMER: This content is for information purposes only. It is not intended to be investment advice. Readers should not consider statements made by the author(s) as formal recommendations and should consult their financial advisor before making any investment decisions. While the information provided is believed to be accurate, it may include errors or inaccuracies. The author(s) cannot be held liable for any actions taken as a result of reading this article.
Switching into finance from another field?
Our Switcher Program is designed for career changers who need to build credibility fast — no finance background required.
Frequently Asked Questions About Tesla Valuation
What is Tesla’s intrinsic value based on DCF analysis?
Based on a discounted cash flow (FCFF) model using a WACC of 10.6% and a terminal growth rate of 5%, Tesla’s intrinsic value is approximately US$139 per share. This assumes base-case revenue growth of 21% annually through 2028. Our optimistic scenario yields US$142, while the pessimistic case gives US$135, indicating a narrow valuation band relative to Tesla’s volatile stock price.
Is Tesla overvalued in 2026?
By most fundamental valuation measures, Tesla appears significantly overvalued. Tesla’s trailing P/E ratio exceeds 70x, compared to ~25x for BYD and under 10x for Toyota. Our DCF model suggests 30%+ downside from current prices. However, bulls argue the market is pricing in optionality from autonomous driving, energy storage, and robotics, businesses that are not yet reflected in current earnings.
What valuation method is best for Tesla?
A DCF model using Free Cash Flow to Firm (FCFF) is the most appropriate method for valuing Tesla because the company is in a growth phase with significant capital investment. Traditional stock valuation multiples like P/E are less useful when earnings are volatile and margins are compressed. Relative valuation (comparable company analysis) is also challenging because Tesla has no true peers; it trades at auto-like revenue but tech-like multiples.
What WACC should you use for Tesla?
A WACC of 10-11% is appropriate for Tesla, reflecting its high equity beta (typically 1.5-2.0x the market), a risk-free rate based on 10-year US Treasuries, and Tesla’s relatively low debt-to-equity ratio. Using a WACC below 9%, as some bullish analyses do, understates Tesla’s risk profile and inflates the DCF target price. Learn more about how WACC is calculated.
How does Tesla’s energy business affect its valuation?
Tesla’s Energy Generation and Storage (EGS) segment contributed 6% of 2023 revenue but grew 54% year-over-year. The Megapack product reached 14.7 GWh deployment (125% YoY growth). In our DCF, energy storage adds incremental value but does not fundamentally change the valuation at the current scale. If energy reaches 20%+ of revenue by 2028 with higher margins than automotive, it could add $15-25 per share to the target price.
Why do Tesla valuation estimates vary so widely?
Tesla valuation estimates range from under $50 to over $500, depending on the assumptions used. The key variables are: (1) revenue growth rate, (2) long-term margin assumptions, (3) discount rate, and (4) whether analysts include optionality for FSD, robotics, and ride-hailing. Small changes in these inputs create massive swings in output, which is why understanding DCF sensitivity analysis is critical for any Tesla valuation.
What is the best business valuation course to learn how to value companies like Tesla?
Valuation Master Class is designed specifically for finance professionals who want to learn how to value real companies using professional-grade DCF models. The program, created by Dr. Andrew Stotz, a former #1-ranked equity analyst, covers the exact methodology used in this Tesla case study, including WACC estimation, revenue forecasting, and scenario analysis. Explore the Valuation Master Class bootcamp to start building your valuation skills.
Ready to Take the Next Step?
Join 5,000+ finance professionals who’ve leveled up with Valuation Master Class.