What Is Cost of Equity?
The cost of equity is the rate of return a company must offer its shareholders to compensate them for the risk of investing their capital. It represents the minimum return investors expect to earn on equity, and if a company cannot meet this threshold, rational investors will allocate their money elsewhere.
Cost of equity is a critical input in company valuation methods such as discounted cash flow (DCF) analysis, where it serves as the discount rate for equity cash flows. It is also a key component of the weighted average cost of capital (WACC), which blends the cost of equity and cost of debt to determine a firm’s overall cost of financing.
Unlike the cost of debt, which is directly observable through interest payments cost of equity is not a contractual obligation. Instead, it must be estimated using financial models. The two most widely used approaches are the Capital Asset Pricing Model (CAPM) and the Dividend Growth Model (DGM), also known as the dividend capitalization model.
This guide explains both formulas step by step, provides worked numerical examples, and shows how the cost of equity is applied in real-world valuation.
Starting your finance career?
If you are building your foundation in DCF valuation and financial modeling, our Starter Program gives you the skills to land your first analyst role, including DCF valuation, financial modeling, and interview preparation.
What Factors Affect the Cost of Equity?
The cost of equity depends on several variables, and these differ depending on which calculation method you use. Here are the six primary drivers:

CAPM Inputs
- Risk-free rate (Rf): The return on a theoretically risk-free investment, typically represented by the yield on long-term government bonds such as the U.S. 10-year Treasury. A higher risk-free rate increases the cost of equity. Learn more about this concept in our guide to the risk-free rate.
- Equity risk premium (ERP): The additional return investors demand for holding stocks rather than risk-free assets. Professor Aswath Damodaran of NYU Stern publishes updated equity risk premium estimates regularly. For a deeper understanding, see our article on equity risk premium.
- Beta: A measure of a stock’s sensitivity to overall market movements. A beta of 1.0 means the stock moves in line with the market. Higher beta means higher cost of equity because the stock carries more systematic risk.
Dividend Growth Model Inputs
- Dividends per share (D1): The expected dividend payment next period. Companies with larger dividends relative to their stock price generally have higher implied costs of equity.
- Current stock price (P0): The market value of the stock today. A lower price (all else equal) implies a higher cost of equity.
- Dividend growth rate (g): The expected annual rate at which dividends will grow. Faster growth increases the cost of equity because investors are pricing in higher future returns.
How Do You Calculate Cost of Equity?
There are two primary methods to calculate the cost of equity: the Capital Asset Pricing Model (CAPM) and the Dividend Growth Model (DGM). Each has strengths and limitations. Professional analysts often calculate both and compare results.
Method 1: The CAPM Formula
The Capital Asset Pricing Model (CAPM) estimates the cost of equity based on the relationship between risk and expected return:
Ke = Rf + B x (Rm – Rf)
Where:
- Ke = Cost of equity (expected return)
- Rf = Risk-free rate (e.g., 10-year U.S. Treasury yield)
- B = Beta of the stock (systematic risk measure)
- Rm = Expected return of the market
- (Rm – Rf) = Equity risk premium (the extra return above the risk-free rate that investors demand for holding stocks)
Worked Example – CAPM:
Suppose you are valuing a technology company with the following inputs:
- Risk-free rate (Rf): 4.0% (current 10-year Treasury yield)
- Expected market return (Rm): 10.0%
- Beta (B): 1.3
Ke = 4.0% + 1.3 x (10.0% – 4.0%) Ke = 4.0% + 1.3 x 6.0% Ke = 4.0% + 7.8% Ke = 11.8%
This means investors in this stock require an 11.8% annual return to compensate for the risk they are taking. If the company cannot generate returns above 11.8%, the stock is likely overvalued.
Method 2: The Dividend Growth Model Formula
The Dividend Growth Model (DGM), also called the dividend capitalization model or Gordon Growth Model, estimates the cost of equity using expected dividends. This is the formula behind the query “dividend growth model cost of equity formula”:
Ke = (D1 / P0) + g
Where:
- Ke = Cost of equity
- D1 = Expected dividend per share next year
- P0 = Current stock price
- g = Expected constant dividend growth rate
To understand the theory behind this formula, see our guide on the Gordon Growth Model.
Worked Example – Dividend Growth Model:
Suppose you are analyzing a utility company:
- Current annual dividend (D0): $3.00 per share
- Expected dividend growth rate (g): 5% per year
- Current stock price (P0): $50.00
First, calculate D1 (next year’s expected dividend): D1 = D0 x (1 + g) = $3.00 x 1.05 = $3.15
Then apply the formula: Ke = ($3.15 / $50.00) + 5% Ke = 6.3% + 5.0% Ke = 11.3%
This means the market implicitly requires an 11.3% return on this stock based on its dividend yield and expected growth.
CAPM vs. Dividend Growth Model: Which Should You Use?
| Feature | CAPM | Dividend Growth Model |
|---|---|---|
| Works for non-dividend stocks? | Yes | No, requires dividend payments |
| Inputs needed | Risk-free rate, beta, market return | Dividend, stock price, growth rate |
| Risk consideration | Systematic risk (beta) | Implied through dividend yield |
| Widely used by | Professional analysts, academics | Investors analyzing mature, dividend-paying companies |
| Key limitation | Beta estimation is subjective | Assumes constant dividend growth |
| Best for | Growth stocks are any public company | Utilities, REITs, blue-chip dividend payers |
In practice, most analysts prefer CAPM because it can be applied to any public company regardless of whether it pays dividends. However, the dividend growth model provides a useful cross-check for companies with stable dividend histories.
Why Is Cost of Equity Important?
Cost of equity matters for three critical reasons:
- It is the discount rate for equity valuation: In a DCF valuation model, the cost of equity is used to discount future cash flows to shareholders back to their present value. If the cost of equity is too low, the valuation will be inflated. If it is too high, the valuation will understate the company’s worth. Getting this input right is essential to producing a defensible valuation.
- It determines the hurdle rate for corporate investments: Companies use the cost of equity to evaluate whether new projects or investments will generate adequate returns. A project must earn at least the cost of equity to create value for shareholders. If it earns less, the company is destroying shareholder value — even if the project is profitable on an accounting basis.
- It feeds directly into WACC: The weighted average cost of capital (WACC) combines the cost of equity and cost of debt, weighted by the company’s capital structure. WACC is the most commonly used discount rate in enterprise-level DCF models. A small error in the cost of equity estimate can significantly distort the final WACC and therefore the entire valuation.
- It helps investors compare investments: By calculating the cost of equity for different companies, investors can assess which stocks offer adequate compensation for their risk level. A stock whose expected return falls below its cost of equity is likely overpriced, a signal to sell or avoid.
Is Finding a Firm’s Cost of Equity Straightforward or Difficult?
Finding a firm’s overall cost of equity is difficult, and understanding why is important for any analyst.
Unlike interest payments on debt, which are contractually defined and easy to observe, the cost of equity is a theoretical concept. It must be estimated, and every estimation method requires assumptions that introduce uncertainty:
- CAPM requires estimating beta, which changes depending on the time period, data frequency, and benchmark index used. A stock’s beta can differ significantly depending on whether you use 2 years or 5 years of historical data. (See our article on the dangers of using calculated beta for more on this problem.)
- CAPM requires an equity risk premium estimate, and reasonable estimates can range from 4% to 7% depending on methodology and geography. Professor Damodaran’s data is a widely respected source, but it is one of many approaches.
- The Dividend Growth Model requires a constant growth rate assumption, which rarely holds perfectly in practice. Companies cut, raise, or suspend dividends based on business conditions.
- Different methods produce different results. It is common for CAPM and the Dividend Growth Model to produce cost of equity estimates that differ by 1-3 percentage points for the same company.
This is why professional analysts typically calculate the cost of equity using multiple methods, compare the results, and apply judgment. An unreasonable cost of equity is one of the most common valuation mistakes, and it often stems from blindly trusting a single model’s output.
How to Apply Cost of Equity in Practice
Understanding the formula is one thing. Applying it correctly in real valuation work is what separates theory from professional judgment.
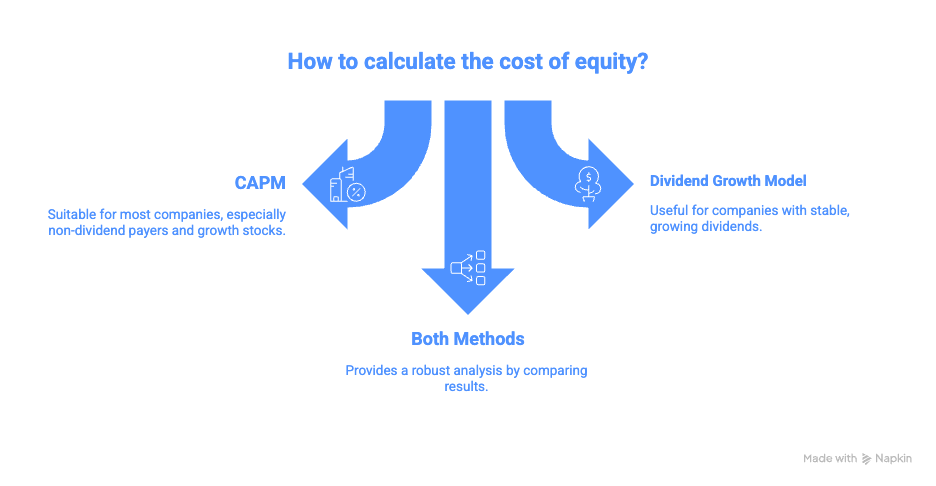
Step 1: Choose Your Model
- Use CAPM for most companies, especially non-dividend payers and growth stocks
- Use the Dividend Growth Model as a cross-check for companies with stable, growing dividends
- For the most robust analysis, calculate using both methods and compare
Step 2: Gather Your Inputs
For CAPM:
- Find the current risk-free rate from Treasury.gov or financial data providers
- Look up the company’s beta on Bloomberg, Yahoo Finance, or Damodaran’s dataset
- Estimate the equity risk premium using Damodaran’s country risk premium data or historical market return data
For the Dividend Growth Model:
- Find the company’s most recent annual dividend per share
- Estimate the dividend growth rate from historical trends (3-5 year CAGR)
- Get the current stock price
Step 3: Calculate and Cross-Check
Run both formulas (where applicable) and compare. If the results differ by more than 2 percentage points, investigate why. Common causes include:
- Beta estimation period mismatch
- Overly optimistic dividend growth rate assumption
- An equity risk premium that does not reflect current market conditions
Step 4: Apply to Your Valuation
Once you have a cost of equity estimate, use it as:
- The discount rate in an equity DCF or dividend discount model
- The equity component of WACC for enterprise DCF models (see how to build a DCF model)
- A benchmark to compare against a company’s return on equity (ROE). If ROE exceeds the cost of equity, the company is creating shareholder value
Ready to advance?
If you already understand CAPM, WACC, and DCF but want deeper valuation and equity research skills, the Advancer Program helps mid-career professionals sharpen their methodology and stand out for promotions or lateral moves into investment roles.
Consistency Is Essential
When comparing the cost of equity across companies, always use the same methodology. Comparing one company’s CAPM-derived cost of equity against another’s DGM-derived estimate produces misleading results. Professional analysts standardize their approach across an entire coverage universe.
Cost of Equity vs. Cost of Debt: What Is the Difference?
Understanding the difference between the cost of equity and the cost of debt is essential for calculating WACC and analyzing a company’s capital structure.
| Feature | Cost of Equity | Cost of Debt |
|---|---|---|
| Definition | Return required by shareholders | Interest rate paid to lenders |
| Observable? | No, must be estimated | Yes, contractual interest rate |
| Tax deductible? | No | Yes, interest expense reduces taxable income |
| Typical range | 8%–15% for most public companies | 3%–8%, depending on credit quality |
| Risk level | Higher (equity holders are last in line) | Lower (debt holders are paid first) |
| Used in | Equity DCF, dividend discount model | Enterprise DCF via WACC |
The cost of equity is always higher than the cost of debt for the same company because equity holders bear more risk. They are last in line during liquidation and have no guaranteed payments. This risk premium is why companies with more debt (higher leverage) typically have higher costs of equity; the remaining equity becomes riskier.
Common Mistakes When Estimating Cost of Equity
Analysts frequently make these errors when calculating the cost of equity. Avoiding them will produce more reliable valuations:
- Using the wrong risk-free rate: The risk-free rate should match the currency and duration of the cash flows being discounted. For a 10-year DCF in U.S. dollars, use the 10-year U.S. Treasury yield, not a 3-month T-bill rate or a foreign government bond.
- Using raw calculated beta without adjustment: Historical beta can be noisy and unreliable, especially for thinly traded stocks or during volatile periods. Many analysts use adjusted beta (which blends raw beta toward 1.0) or industry average beta. See VMC’s analysis of why using calculated beta can be dangerous.
- Ignoring country risk: For companies operating in emerging markets, the standard equity risk premium may understate risk. Damodaran recommends adding a country risk premium to the CAPM formula for these markets.
- Assuming unrealistic dividend growth rates: In the Dividend Growth Model, the growth rate (g) must be less than the cost of equity (Ke). If g approaches or exceeds Ke, the formula breaks down and produces nonsensical results. Growth rates should be anchored to historical trends and GDP growth expectations.
- Not sanity-checking the output: A cost of equity below 6% or above 20% for a public company in a developed market should raise a red flag. Always compare your estimate against industry averages and peer companies. For more on this, read Choosing an Unreasonable Cost of Equity.
Frequently Asked Questions About Cost of Equity
What is a good cost of equity?
A “good” cost of equity depends on the industry, market conditions, and risk profile of the company. For most public companies in developed markets, the cost of equity typically falls between 8% and 14%. Utility companies with stable cash flows often have costs of equity around 8-10%, while high-growth technology companies may require 12-15% or more. The key benchmark is whether the company’s return on equity exceeds its cost of equity. If it does, the company is creating shareholder value.
What is the difference between the cost of equity and WACC?
Cost of equity represents only the return required by shareholders, while the weighted average cost of capital (WACC) blends the cost of equity and cost of debt, weighted by the company’s capital structure. WACC is always lower than the cost of equity because debt is cheaper (due to the tax shield on interest payments). In a DCF valuation, use the cost of equity to discount cash flows to equity holders, and use WACC to discount free cash flows to the firm.
Can you calculate the cost of equity for a private company?
Yes, but it requires additional estimation. Since private companies do not have publicly traded shares, you cannot directly observe their stock price or calculate beta from market data. Analysts typically use the beta of comparable public companies (peer group beta) and may add a size premium or illiquidity premium to the CAPM formula. The dividend growth model is rarely applicable because most private companies do not pay regular dividends.
Why is the cost of equity higher than the cost of debt?
Cost of equity is always higher than the cost of debt because equity investors bear more risk. Debt holders receive contractual interest payments and have priority in bankruptcy, while equity holders receive returns only after all obligations are met. Additionally, interest payments on debt are tax-deductible, which further reduces the effective cost of debt. This risk differential is fundamental to how WACC is calculated and why companies with more leverage typically have lower WACCs (up to a point).
How does beta affect the cost of equity?
Beta measures a stock’s sensitivity to market movements and directly impacts the cost of equity in the CAPM formula. A beta of 1.0 means the stock moves in line with the market. A beta above 1.0 (e.g., 1.5) increases the cost of equity because the stock is more volatile than the market, so investors demand higher returns. A beta below 1.0 (e.g., 0.7) lowers the cost of equity because the stock is less sensitive to market swings. Learn more about this variable in our beta guide.
What is the dividend growth model cost of equity formula?
The dividend growth model cost of equity formula is Ke = (D1 / P0) + g, where D1 is the expected dividend per share next year, P0 is the current stock price, and g is the expected constant dividend growth rate. This formula is derived from the Gordon Growth Model, which values a stock as the present value of its future dividends growing at a constant rate. It only works for companies that pay dividends and have a predictable growth rate.
Where can I learn cost of equity and valuation online?
The most effective way to master the cost of equity is to apply it in real valuation models, not just memorize formulas. Valuation Master Class is a business valuation course designed by Dr. Andrew Stotz, a former top-ranked equity analyst, that teaches cost of equity estimation, DCF modeling, and WACC calculation through hands-on company analysis. Whether you are starting your finance career or switching from another field, the program gives you practical skills used by professional analysts.
Switching into finance from another field?
If you are transitioning into finance and need structured credibility building, our Switcher Program is designed for career changers who need to build practical valuation skills fast, even without a finance background.