Mistake #5: Forecasting Drastic Changes in the Cash Conversion Cycle

Mistake #5, which we’re going to talk about now, is forecasting drastic changes in the cash conversion cycle.
First though, let’s review the full list of Top 9 Mistakes. Catch up with the other posts here.
The Top 9 Valuation Mistakes
- Overly optimistic revenue forecasts
- Underestimating expenses causing unrealistic profit forecasts
- Growing fixed assets slower than revenue
- Confusing growth with maintenance Capex
- Forecasting drastic changes in cash conversion cycle
- Underestimating working capital investment
- Valuing a stock using the calculated Beta
- Choosing an unreasonable cost of equity
- Not properly fading the return on invested capital
What Is Working Capital?
There are so many terms in finance for working capital: current assets; current liabilities; working capital; gross working capital; net working capital; operating working capital; working capital investment; and operating cash flow—so many different terms. So, let’s look at working capital from a valuation perspective.
First, let’s review current assets and current liabilities. What is the right level of current assets? Well, my answer is zero.
I need to have current assets because I have to give someone credit; that’s accounts receivable. I have to have current assets because I have to have inventory on the floor.
Why don’t I have just-in-time inventory? Why do I need them? The truth is, while you don’t want them, you do need them. So, the objective is to try to reduce them down to as close as zero as possible.
There are three main accounts when we look at current assets.
1. Cash and marketable securities
2. Accounts receivable (AR)
- Money customers owe that will convert to cash soon (usual credit terms are 30, 60 or 90 days)
3. Inventory (Inv.)
- Finished goods ready to sell/raw material or work in process
On top of the three main accounts, we also have other current assets (OCA) too. Let’s look at a way of grouping this:
- Current assets = Cash + AR + Inv. + OCA
The most liquid here are cash and accounts receivable, and that’s the reason why banks will often discount these accounts receivables, or you can get cash if you need it quickly.
Current Assets Vs. Current Liabilities
Here are the results of a study I’ve done on 17,414 companies across the world to try to understand how assets break down. We could look at the company industries if we really wanted to go into more detail on this, but this gives us a good overall guide.
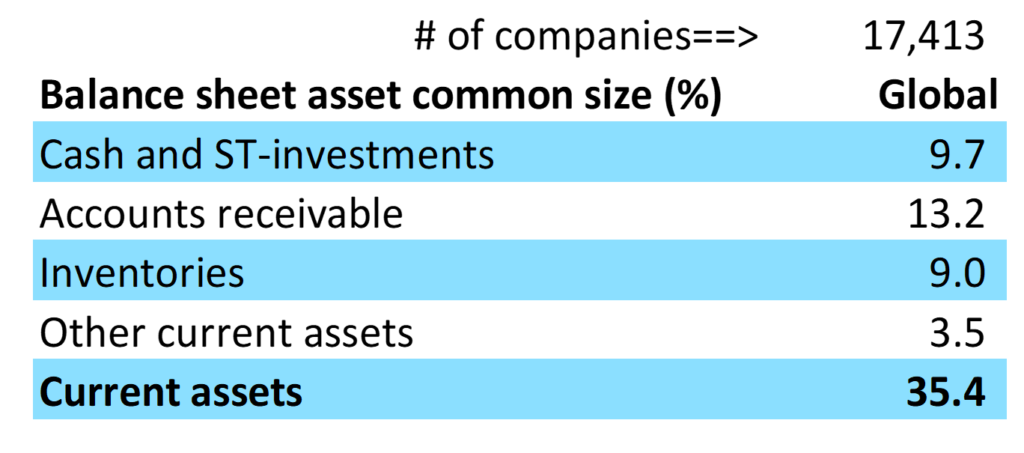
[[Fig. 5.1 Review of Global Current Assets Show That Accounts Receivable Is Largest at 13%]]
We can see that 35.4% is the number of current assets relative to total assets. It’s a big number. A large amount of money that’s raised to support a business is used here in this metric.
Furthermore, the number one account is account receivable. Inventories, cash, and other current assets are small.
Now to review current liabilities for two main accounts:
1. Short-term borrowing
- Includes short-term notes, overdrafts, a current portion of long-term debt
2. Accounts payable (AP)
- Includes money due to vendors who have supplied goods or services
PLUS: Other current liabilities (OCL)
- Includes deferred revenues, customer advances, accrued compensation, accrued taxes, and declared but unpaid dividends
Let’s go back to my worldwide company research for current liabilities this time (Fig. 2).
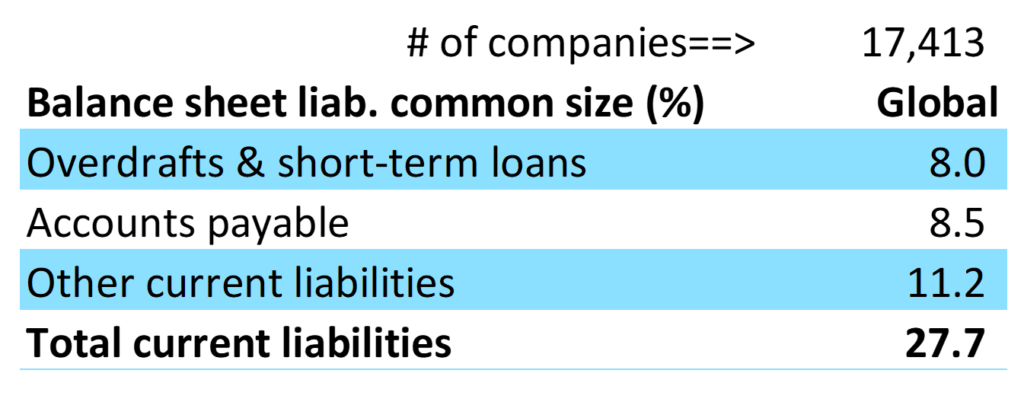
[[Fig. 5.2 Current Liabilities]]
Here we see that the other current liabilities metric is large at 11.2, but I can’t break it down further into one more category. Therefore, if we look at the other ones, it’s about 8 to 8.5 for accounts payable and overdrafts. Let’s put them side by side to help us understand better.
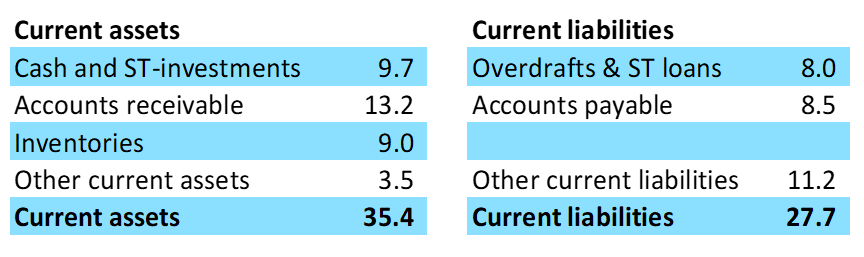
[[Fig. 5.3 Current Assets Vs. Current Liabilities]]
The two charts compare quite well: the left-hand cash is a lot like the right-hand overdrafts. Account receivables are just the opposite of accounts payables. There’s no inventory item that’s comparable in current liabilities, so I’ve left that blank. And then, there are the other current assets and other current liabilities. Now, let’s take that same chart and create a visual representation:
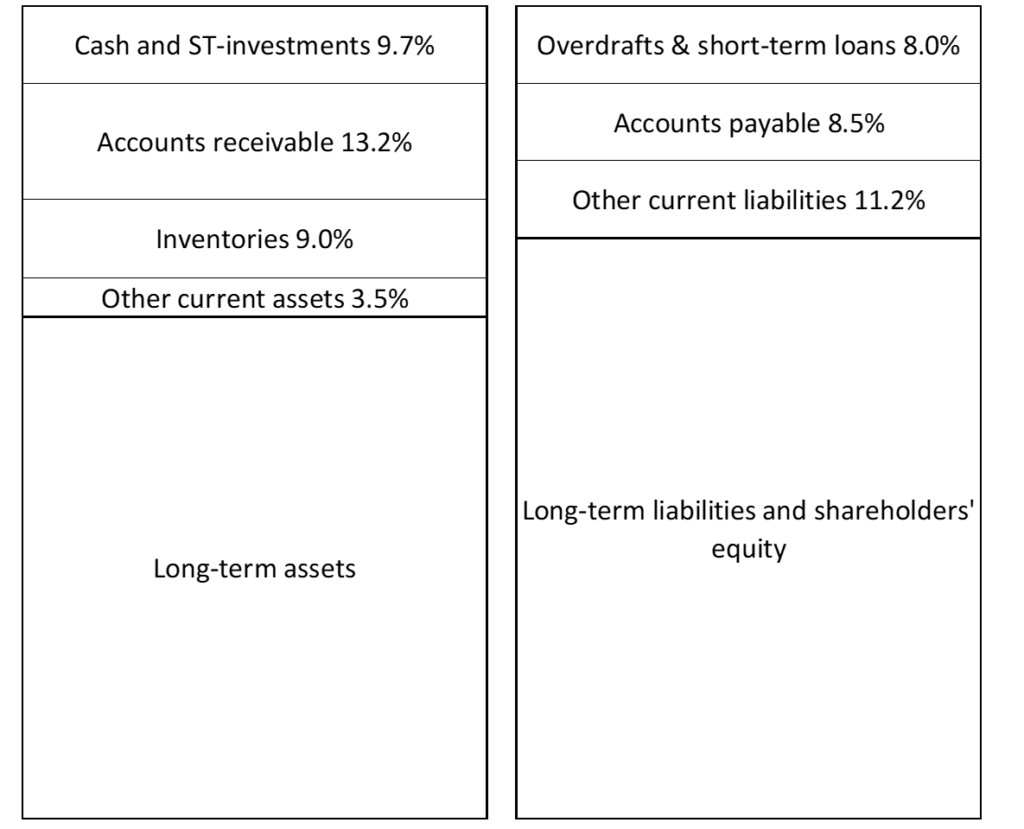
[[Fig. 5.4 Current Assets Vs. Current Liabilities Version 2]]
Here we have the same breakdown of the percentages, but you can see that long-term liabilities and shareholders’ equity for your average company are much bigger than the long-term assets.
In other words, companies are financing themselves with long-term liabilities and shareholders’ equity.
Here’s the working capital change for all those global companies (Fig. 5.5) across time since 1995. You can see that these charts are pretty flat.
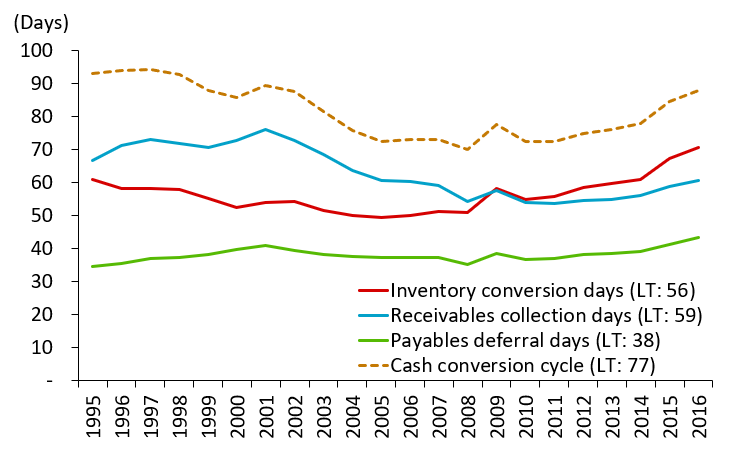
[[Fig. 5.5 Working Capital Changes]]
What this chart shows us:
-
- Working capital items change, but they change slowly.
- The companies average inventory conversion is 56 days. The average receivable collection is 59. They do trend, but they do not usually change dramatically.
- Payables deferral days help us calculate a cash conversion cycle, which is the inventories and the receivables minus deferrals.
- And what we can see is that the cash conversion cycle is about 77 days, on average, throughout the whole time.
- The global long-term average of 56 days for inventory conversion shows it’s a large portion of the company’s cash conversion cycle.
What does all this bring us to? The important point to draw from the chart here is the cash conversion cycle, which is a combination of these different items: the inventory conversion, the receivable collections, and the accounts payable.
And when it comes to the cash conversion cycle, I like to focus on inventory.
Why Focus on Inventory?
It’s the handling of inventory that is really a core function of management, and it’s the one thing that companies can control right now. When I focus on this item, I’ve often found that analysts forecast unrealistic changes in a company’s inventory conversion period because they’re not taking into consideration how hard it is to actually change.
Here’s a forecasting example of a company, Kingsmen Creatives to demonstrate how easy it is to make this valuation mistake.
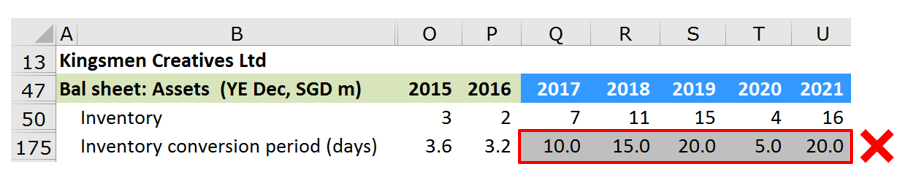
[[Fig. 5.6 Valuation Mistake #5 Example]]
In the model that we use, the ValueModel, you can see that their inventory conversion days have been over three days. And then, all of a sudden, the analyst expects that it’s going to take ten days in 2017. That’s very unlikely. Even more unlikely is that it then jumps 15, 20, 5, and then 20 again—what happened!
How to Avoid This Common Mistake?
It’s important to remember that huge year-to-year changes only happen in truly exceptional cases. Significant changes in product mix or the introduction of new products can occasionally cause such huge annual changes. But, generally, annual forecasts should not deviate substantially from the historical numbers.
Unless you have a story to explain this narrative, analysts need to try to keep it pretty close to what it has been in the past to avoid this valuation mistake.
To do this, focus a lot on inventory conversion. The number of inventory days helps a business owner understand the just-in-time nature of its raw material supply chain; the efficiency of its operations, its work in process; and the level of finished goods it keeps in stock.
Mistake #5 Conclusion
-
-
-
- Avoid huge changes in the working capital items except in rare cases of product mix or management policy.
- Average guidelines for company working capital metrics measured across the world:
-
-
—Long-term inventory days: 56 days
—Receivable days: 59 days
—Payable days: 38 days
—Cash conversion days: 77 days
-
-
-
- Focus much of your analyst attention on inventory.
- It’s great if you do forecast big changes, just explain your reasons carefully. This will be your chance to stand out as an analyst if you’re accurate!
-
-
So, there you have it. That’s Valuation Mistake #5: Forecasting drastic changes in the cash conversion cycle. Don’t forget to watch the video that accompanies this chapter:/
Next up in the Top 9 Valuation Mistakes blog series is #6, in which we discuss underestimating working capital investment. See you there!
The Valuation Master Class is an on-demand online course that trains attendees to become company valuation experts. Graduates can confidently value any company and possess the in-demand industry skills needed to succeed as investment bankers, asset managers, equity analysts, or value investors.
Click here to learn more about Valuation Master Class Foundation.
The Valuation Master Class Boot Camp presents the Valuation Master Class Foundation material in a 6-week guided online course format. Daily live sessions, teamwork, progress tracking, and the intensive nature help guide attendees to completion. The final company valuation project and presentation is tangible evidence of the attendee’s practical valuation experience and dedication to building a career in finance.