Mistake #2: Underestimating Expenses Causing Unrealistic Profit Forecasts
Welcome to the second installment of my Top 9 Valuation Mistakes blog series. In today’s post, we’ll examine Valuation Mistake #2: Underestimating expenses causing unrealistic profit. Let’s just quickly remind ourselves of the full nine valuation mistakes that analysts are in danger of making.
The Top 9 Valuation Mistakes
- Overly optimistic revenue forecasts
- Underestimating expenses causing unrealistic profit forecasts
- Growing fixed assets slower than revenue
- Confusing growth with maintenance Capex
- Forecasting drastic changes in cash conversion cycle
- Underestimating working capital investment
- Valuing a stock using the calculated Beta
- Choosing an unreasonable cost of equity
- Not properly fading the return on invested capital
Don’t forget to check out Valuation Mistake #1 in the series. Now though, without further ado, let’s begin with Mistake #2.
The Fig. 1 table below shows the results of the research which supports the foundations for this Valuation Mistake. I’ve taken 17,000 companies from across the world, I’ve added all of them up into one balance sheet, one income statement, and one cash flow statement. And I’ve done this for over a 15-year period rather than just looking at the most recent years or over particular portions of an economic cycle.
Over 15 years, the net profit margin of companies globally is 5.5% on average. When times are good, it’s going to be a little bit above that; when times are bad, it’s going to be a little bit below. Of course, different companies and different industries are going to have different levels. So, this is really just a global concept.
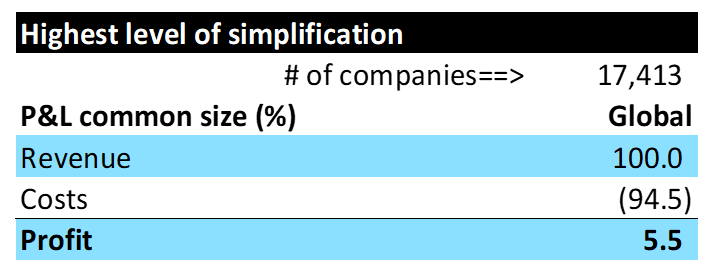
Fig. 1 Costs at 17,000 Companies Across the Globe, over 15 Years, Account for 94.5% of Revenue
Every business is trying to hold their profit margin above industry standard and be as strong as possible. It easy to fall on your gross margin if you’re not focused. Raising your gross profit margin though, which is where analysts are usually over-optimistic, and expecting it to rise just by one percent is damned hard.
The next level of detail in P&L (Fig. 2) shows another level of data simplification. We’ve got the same 100% revenue at the top and the same 5.5% at the bottom. But the key thing to look at here is the Cost of Goods and Services sold (named so because when we’re looking at every company in the world, we could be talking about a service company or a manufacturing company). The point is that 70.4% of cost of goods and services sold (normally COGS) accounts for 70.4% of revenue.
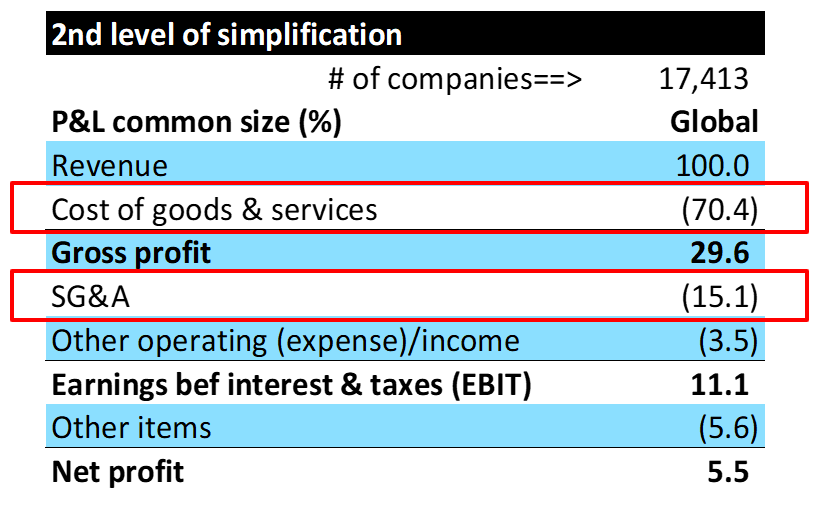
Fig. 2 Breaking the P&L Down Shows Cogs Account for 70.4% of Revenue
Now, if you look at Selling, General and Administrative Expenses (SG&A), it’s pretty big at 15.1. It’s the second biggest outgoing, but not by a large margin. It’s the COGS that is the critical item to forecast here.
First of all, don’t confuse gross profit, which is a dollar amount, with gross profit margin which is a percentage amount. We can arrive at gross profit by looking at revenue minus cost of goods sold or cost of goods and service. We arrive at gross profit margin by gross profit divided by the revenue.
Forecasting optimistically is a common mistake, but a small percentage change—even a 1% increase in gross margin—can have a massive impact on the net profit. Analysts tend to be overly optimistic and forecast a high or rising gross margin—see the first blog in this series for more detail. But they need to remember that it is very hard for a management team to sustainably increase the gross profit margin at this kind of level.
How Accurate Are Analysts Net Profit and Net Profit Margin Forecasts in Asia?
Have you ever watched CNBC and they say, “Hey, this company has beaten its forecast or the Street estimate by one cent”? How can that be?
I was an analyst for 20 years forecasting companies and I don’t think I ever got one cent close to a forecast.
Here’s the reason why. Firstly, such companies are feeding the analysts a huge amount of information compared to others. But the second thing and, more importantly, is that we are rarely talking about a forecast that’s over a long period of time.
It could actually just be a week’s worth of forecast—in other words, CNBC commentators are pulling the latest consensus forecast just that day. And that latest consensus forecast for the period and time that the company is reporting has been updated over and over and over.
So, it’s not they missed by one cent; it’s that they reduced the measuring period of a miss. Here is some of the academic work that I’ve done on the forecast accuracy of analysts. The chart below (Fig. 3) shows the percentage of companies where analysts’ forecasts were inaccurate by sector.
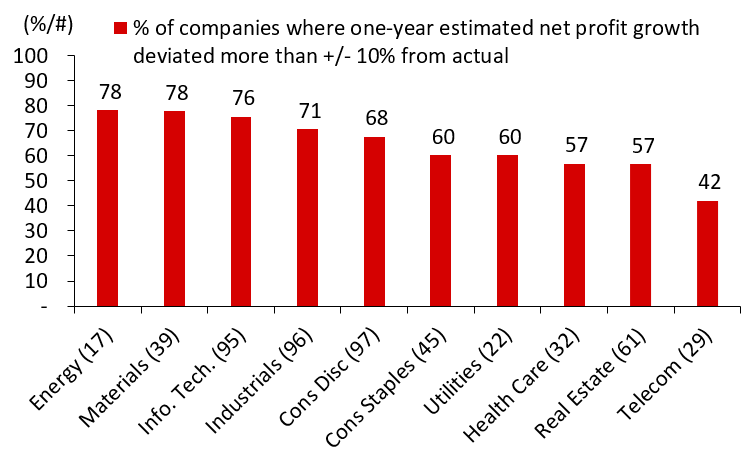
Fig. 3 Results – Best Case, Telcom, Shows Consensus Net Profit Forecasts Only Sector Better Than A Coin Flip
So, what we can see is that, the best case sector; Telecoms, shows the consensus net profit forecast and it’s the only sector that’s better than a coin flip. In fact, all the other sectors are above 50% inaccurate. But what we can see is that Energy and Materials were the least accurate of the sectors. And that gives us an idea of how bad and how tough it is to forecast earnings.
Net Profit Margin Volatility
Now, let’s look at net profit margin volatility. What I’m looking at is the volatility of the company’s margin over a period of time.
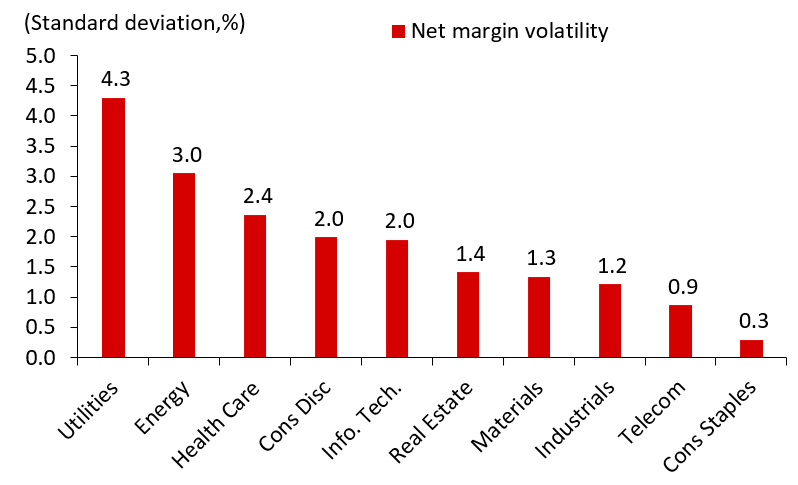
Fig. 4 Utilities and Energy Have the Most Volatile Net Profit Margin
Over the past decade, the highest variability in net profit margin was in the utilities followed by energy. This is not saying that this is the analysts’ forecast fault. We’re just saying what sectors are most volatile when it comes to net profit margin.
Now, the least volatile sector was consumer staples and telecoms. These are the products that people are using every day. When was the last the time you said, “I’m not going to use my phone anymore because the charges are high?” Well, that doesn’t happen very much in the telecom space. Or how about, “I’m going to stop drinking my morning coffee—my daily consumer staple—because prices have gone up.”
It just isn’t going to happen!
Now, what we can see from this is that the biggest forecast error actually comes from utilities which is a little bit odd because you’d think that utilities are stable. Firstly, I would say this partly has to do with utilities’ net profit margin being a function of utility companies—oftentimes, there are subsidiary investments that they’re investing in which can cause a lumpiness in net profit. And secondly, by their very nature, utility companies are lumpy overall.
It’s very common that I see analysts being overly optimistic and then the company not being able to deliver due to unexpected reasons.
Why Is This Important?
To accurately forecast changes in gross profit margin, an analyst should study the supply chain. My advice here is to go and read the book, Understanding Michael Porter: The Essential Guide to Competition and Strategy. Joan Magretta does a great job compounding the argument I’m suggesting here. Which is that any competitive advantage you’re hoping to achieve will come from reviewing your supply chain. Review the cost of raw materials going into the process and how management action, as well as industry factors, may impact that.
If you build your competitive advantage by improving the efficiency of the sales, general, and administrative part of your business, you’re only potentially impacting 15% of your revenue. If on the other hand, you concentrate on improving the 70% that comes under COGS, then that’s where you build your competitive advantage.
Mistake #2 Conclusion
- On average, the cost of goods sold accounts for 70% of revenue and a company’s net margin is 5.5% throughout the economic cycle over the last 15 years or so.
- Reduce forecasting focus to mainly revenue and cost of goods sold. The rest of P&L doesn’t matter as much.
- Most importantly, curb your optimism in the area of forecasting. Stay optimistic in life instead.
Check out the full video here:
In the next blog in this series, I discuss growing fixed assets slower than revenue. Check it out here.
The Valuation Master Class is an on-demand online course that trains attendees to become company valuation experts. Graduates can confidently value any company and possess the in-demand industry skills needed to succeed as investment bankers, asset managers, equity analysts, or value investors.
Click here to learn more about Valuation Master Class Foundation.
The Valuation Master Class Boot Camp presents the Valuation Master Class Foundation material in a 6-week guided online course format. Daily live sessions, teamwork, progress tracking, and the intensive nature help guide attendees to completion. The final company valuation project and presentation is tangible evidence of the attendee’s practical valuation experience and dedication to building a career in finance.