Mistake #7: Valuing a Stock Using the Calculated Beta
Now in the series, let’s move onto one of the most interesting subjects in valuation: beta. Discussing this crucial element of investing will helps us shed more light on the connected #7 top valuation mistake of valuing a stock using the calculated beta.
But first, don’t forget to catch up with the rest of the articles here.
The Top 9 Valuation Mistakes
- Overly optimistic revenue forecasts
- Underestimating expenses causing unrealistic profit forecasts
- Growing fixed assets slower than revenue
- Confusing growth with maintenance Capex
- Forecasting drastic changes in the cash conversion cycle
- Underestimating working capital investment
- Valuing a stock using the calculated Beta
- Choosing an unreasonable cost of equity
- Not properly fading the return on invested capital
What Is Beta?
We can calculate the expected return of a stock via the following calculation. This is a simplified capital asset pricing model.
Expected Return = Risk-Free Rate + Beta (Market Premium)
So, if I’m going to invest in a stock, where the risk-free rate is 4% and the expected market return is 10%, I’m going to get a 6% market premium—assuming beta is 1 for simplicity.
Now, the next question is, how much are we leveraging up that 6%?
That’s dependent upon the riskiness of that stock which is measured by beta. The beta comes in to adjust that market premium as beta is positively correlated with the market. It helps us understand if a stock is more volatile—with a beta of greater than one (β>1)—or less volatile—with a beta of less than one (β<1) than the market. Movement relative to the market is risk that cannot be removed through diversification.
As an example, a government bond may have a beta of zero. It doesn’t have any relationship to the stock market. There are negative beta stocks, but they’re hard to find; and, usually, there are weird things going on to make this happen. Beta is the calculation of change, i.e., the change in the stock relative to the change in the market. In theory, when investing in a high beta stock, an investor generally should demand a higher return.
A few questions to consider now:
- What beta do you use?
- What is your choice of time period?
- What is your choice of frequency of returns?
- What’s the correlation?
Those are the important decisions you have to make when considering beta. And I’m just going to tell you the secret to all this right now. There is no right answer. They’re all wrong. And yet, they could also all be right.
Let’s look at that in a little bit more detail.
Beta: Right & Wrong
Here’s an example of a company—Bumrungrad International Hospital—in Thailand which demonstrates just how flimsy beta can be. In this case, it’s the monthly return beta that varies so widely.
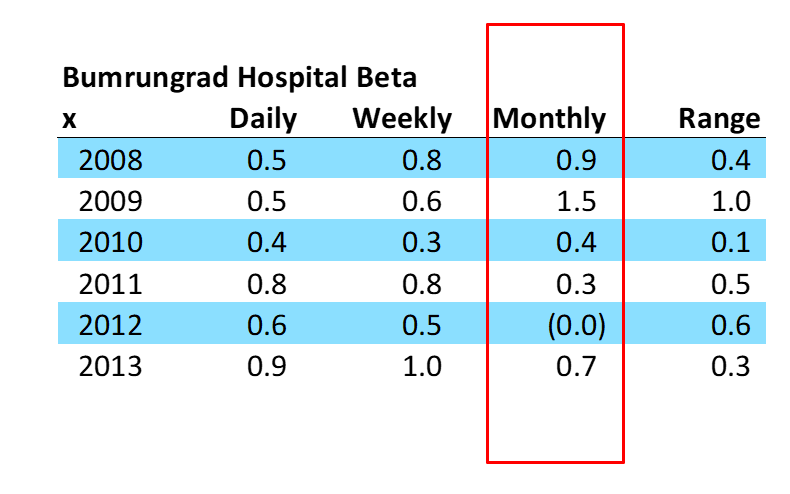
[Fig. 7.1 An Example of How Flimsy Beta Can Be – Part 1]
If you use these figures, depending on whether you’re looking at a one-year, a three-year, a five-year beta, you’re going to get very different results.
Let’s look at how flimsy the beta can be in another direction in just one year. Below, we can see that in 2009, the beta of different frequencies varied massively.
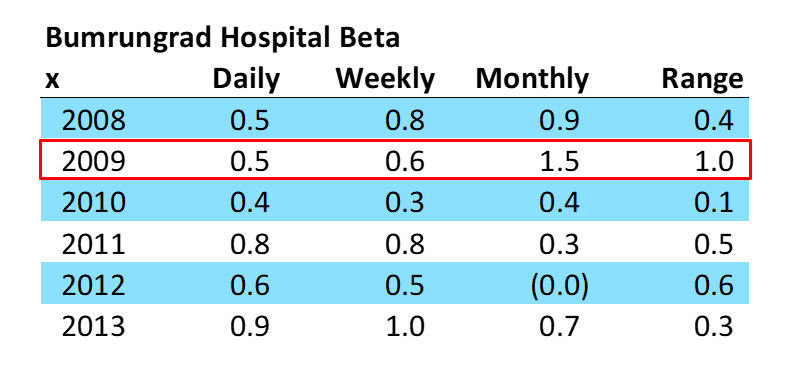
[Fig. 7.2 An Example of How Flimsy Beta Can Be – Part 2]
What Does This All Mean?
If you had calculated the 2009 beta based upon daily returns, you would have gotten 0.5; weekly you would have arrived at 0.6; and monthly, 1.5. The range is massive. Now, you could say, “Well, I’m just going to use Bloomberg’s beta because that’s what everybody else is using.” And yes, that’s possible. But, also it could be the wrong beta to use too.
Which is exactly why one of the top valuation mistakes is valuing a stock using the calculated beta—using a too high or too low beta, using Bloomberg’s beta, or using your own calculated beta will all help you arrive at vastly different metrics.
And here’s when it gets funny.
When is calculating your own beta a mistake? When failing to realize that valuation is made to infinity—hence, your beta is a forecasted beta and that forecast is to infinity.
What Betas Should I Use?
I’ve just blown up a lot of things that you shouldn’t do, so what exactly should you do?
Let’s look at some academic-style research I did about, “Does high risk mean high return?” (When I say, “high risk,” I’m saying “high beta” here.)
So, as part of that research; what happens to beta over time? Are high betas or low betas sustained?
If an analyst were to value a company by looking at the beta in Bloomberg and the beta was 2.0, should we use 2.0 or what?
The hypothesis is that beta changes over time and reverts to 1.0.
Here’s the data compiled:
- I examined 10,000 stocks listed at any point in time on any stock exchange in the world from 1995 to 2015. (We can look at a lot more stocks in this study because we don’t need fundamental data; we just need price data.)
- I considered the top 3 deciles with the highest beta and the bottom 3 deciles with the lowest beta.
- I investigated what happened to the average beta of these stocks over 10 years.
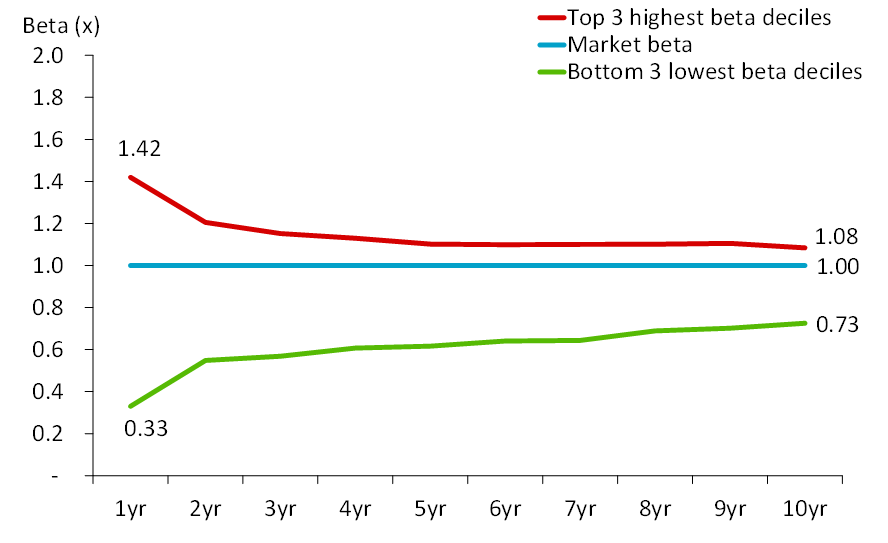
[Fig. 7.3 Highest Beta Deciles Vs. Lowest Beta Deciles]
The results: High beta stocks come down to about 1.1 while low beta stocks stay at about 0.7.
Interesting!
What we can also see is that the lines converge pretty quickly. Within a year or so, the beta could be dramatically different from 1.42 down to 1.2 or from 0.33 up to almost 0.6. All of which tells us that whatever beta you’re calculating today is not the beta you should be using.
How to Avoid This Mistake
- Do not plug in the current beta and think you’ve got it right.
- Keep your betas within a certain range to prevent making mistakes of such extremes: A safe range is 0.75x to 1.5.
When I was head of research, I saw that analysts like to manipulate beta to get the result they want as far as the valuation is concerned. But, really, the market return, the risk-free rate, and the beta selection for each country should be set by the head of research to put a tight range on beta. The benefit of this is that you prevent both yourself and analysts from coming up with extreme valuations.
It doesn’t mean that you can’t go outside of that range, but you’ve got to be able to prove that you have a good reason why.
Mistake #7 Conclusion
- Past betas tend to regress towards 1.00x.
- The beta you use for valuation is to infinity.
- To avoid error, use three betas:
- High risk: 1.25x
- Average risk: 1.00x
- Low risk: 0.75x
- If you use a beta outside of this range, you have a higher obligation to justify why.
- Don’t manipulate the beta to get the calculations you want.
Don’t forget to watch the video that accompanies this chapter:
Coming up in the next blog is the valuation mistake of choosing an unreasonable cost of equity. I’ll see you there!
The Valuation Master Class is an on-demand online course that trains attendees to become company valuation experts. Graduates can confidently value any company and possess the in-demand industry skills needed to succeed as investment bankers, asset managers, equity analysts, or value investors.
Click here to learn more about Valuation Master Class Foundation.
The Valuation Master Class Boot Camp presents the Valuation Master Class Foundation material in a 6-week guided online course format. Daily live sessions, teamwork, progress tracking, and the intensive nature help guide attendees to completion. The final company valuation project and presentation is tangible evidence of the attendee’s practical valuation experience and dedication to building a career in finance.