Coca-Cola Valuation: What Really Drives Revenue (It’s Not Soda)
What Drives Coca-Cola’s Revenue?
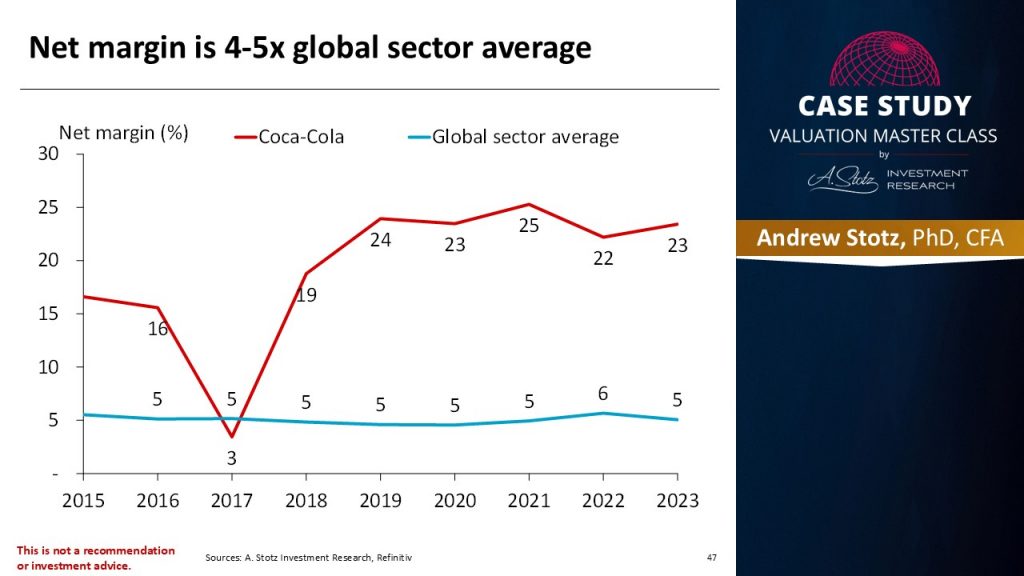
Coca-Cola (NYSE: KO) generates $47.7 billion in annual revenue, but only 42% comes from finished beverages like cans and bottles. The majority 58% comes from selling concentrates and syrups to bottling partners worldwide. This asset-light franchise model produces gross margins of 60-80% on concentrates versus 30-40% on finished products, making Coca-Cola one of the most profitable companies in the consumer staples sector with a net profit margin of approximately 23%.
| Metric | Value |
|---|---|
| Annual Revenue (TTM Q3 2025) | $47.7 billion |
| Revenue from Concentrates | 58% |
| Revenue from Finished Beverages | 42% |
| Gross Margin (Q3 2025) | 61.6% |
| Net Profit Margin | ~23% |
| P/E Ratio | ~26x |
| Dividend Yield | ~3% |
| Global CSD Market Share | ~45% |
| Brands | 500+ across 200 countries |
Here’s a deep dive into how Coca-Cola’s business model works, why concentrates are the real profit engine, and what this means for valuing KO stock.
Starting your finance career?
If you are building your foundation in valuation and financial modeling, our Starter Program gives you the skills to land your first analyst role, including valuation, financial modeling, and interview preparation.
Coca-Cola’s Bold Moves to Stay Ahead of the Curve
The name Coca-Cola is synonymous with fizzy drinks, nostalgia, and global dominance in the beverage industry. But what actually drives the financial success of this iconic brand? Well, it does not actually involve the sugary soda most of us associate with Coca-Cola.
Today, I take a deep dive to uncover Coca-Cola’s strategic evolution, from its origins to its innovative response, changing consumer preferences, and how its core business model continues to drive profitability.
From a Pharmacy Concoction to a Global Giant
In 1886, Dr. John Pemberton, an Atlanta pharmacist, brewed the first Coca-Cola. Since then, the company has grown to offer over 3,600 beverages under 500 brands in 200 countries.
Looking at Coca-Cola’s timeline, you’ll notice a couple of key milestones that have revolutionized the beverage world:
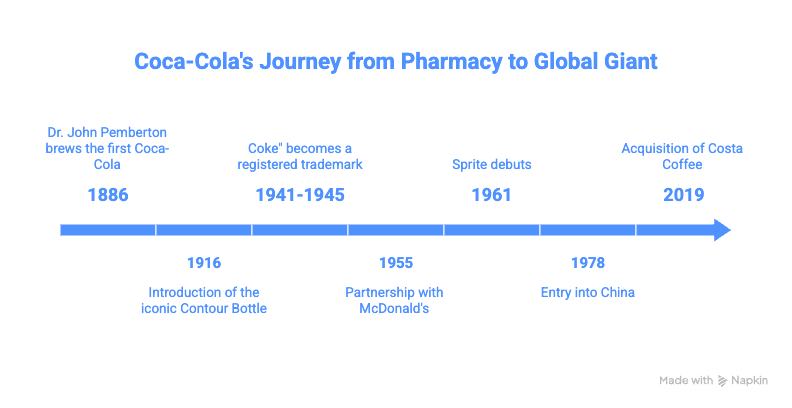
- 1916: The introduction of the iconic Contour Bottle.
- 1941-1945: The term “Coke” became a registered trademark.
- 1955: A historic partnership with McDonald’s brought branded beverages into fast food.
- 1961: Sprite debuted, diversifying Coca-Cola’s soft drink line.
- 1978: Entry into China, where it was the only cold-packaged beverage company.
- 2019: Acquisition of Costa Coffee, marking a strategic shift into the coffee market.
The Decline of Sugary Beverages
The golden age of sugary drinks is notably slowing down. In 2003, 62% of adults and 80% of American children consumed sugary drinks daily. Fast-forward to 2024, and those numbers have dropped to about 50% for adults and 60% for kids.
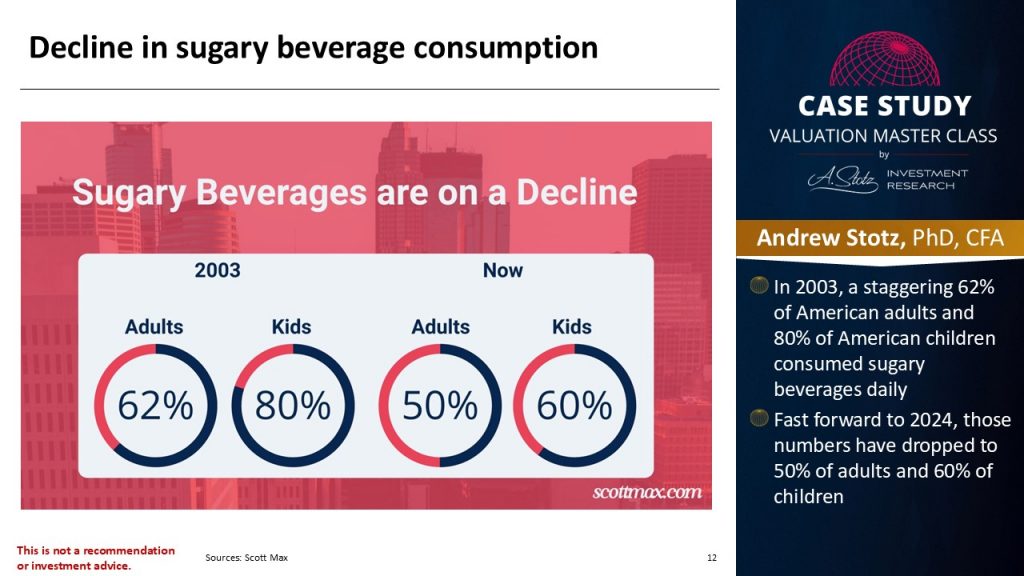
Due to health-conscious consumers who are now aware of the dangers of obesity, social media advocacy, and taxes on sugary drinks, people are shifting toward healthier options. Coca-Cola recognized this trend early, adapting its strategy to remain relevant and profitable.
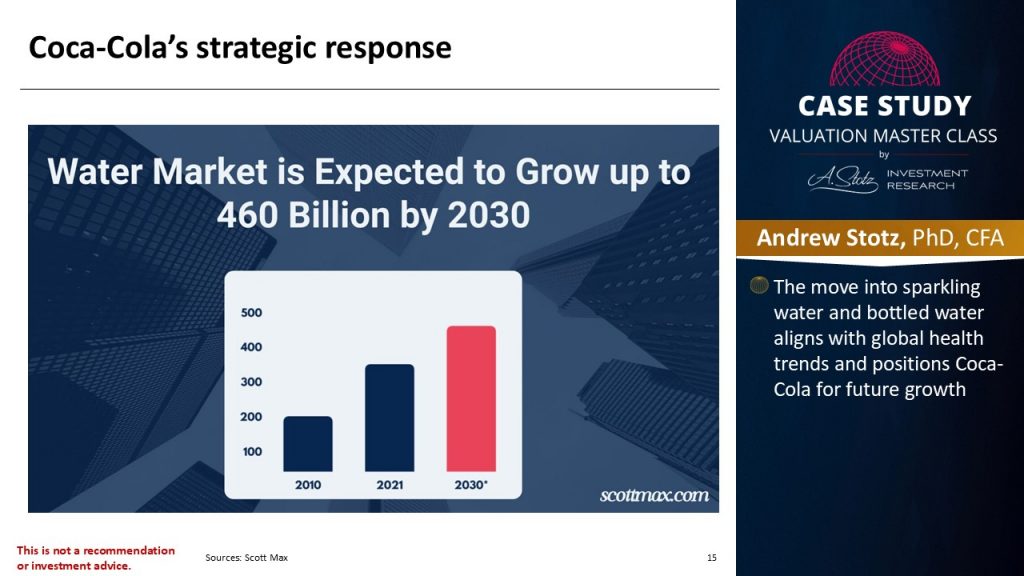
Coca-Cola’s Response: Diversify or Decline
In response to this new trend, Coca-Cola was quite strategic and visionary. It ventured into healthier alternatives by acquiring brands like Topo Chico (sparkling water), BodyArmor (sports drinks), and Mojo (kombucha).
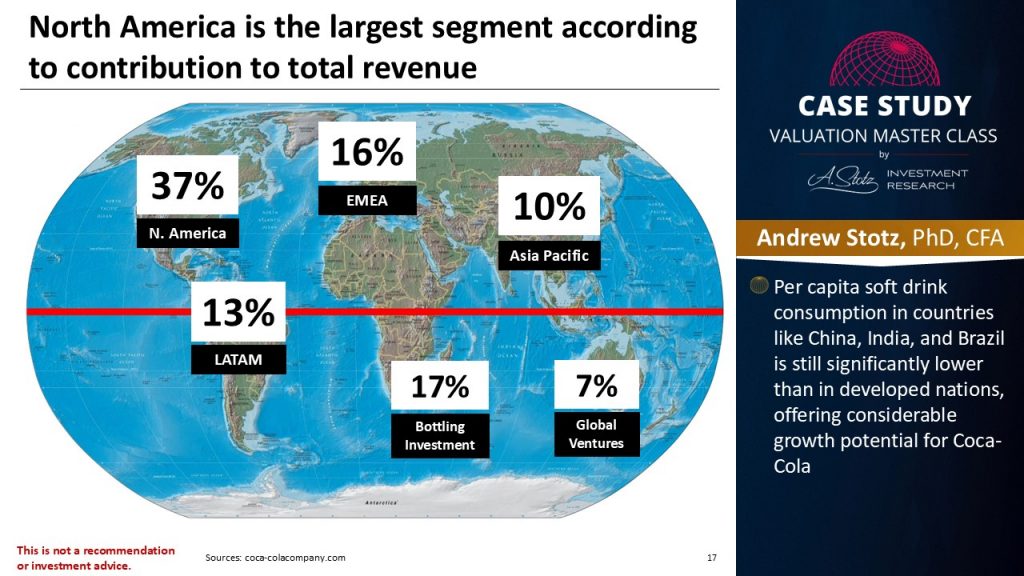
Second, the company tapped into countries like China, India, and Brazil, where per capita soft drink consumption remains low, offering Coca-Cola significant growth opportunities.
Third, Coca-Cola diversified its product range to include coffee (Costa Coffee), dairy (Fairlife), and smoothies (Made Group). This diversification aligns the company with global health trends while positioning it for future growth.
How Does Coca-Cola’s Pricing Power Drive Revenue Growth?
While volume growth has been modest, Coca-Cola’s pricing power has been the dominant growth lever. In 2024, organic revenue grew 12%, driven by 11% growth in price/mix and only 2% growth in concentrate sales volume. The ability to raise prices without losing meaningful volume is a hallmark of companies with strong competitive moats.
This pricing power stems from:
- Brand dominance: Coca-Cola’s brand is valued at over $106 billion, ranked 15th globally. Consumers don’t switch to alternatives when prices rise by a few cents.
- Distribution lock-in: With approximately 14 million units of cold-drink equipment in ~33 million customer outlets worldwide, Coca-Cola’s physical presence creates a self-reinforcing consumption loop. In 2024, the system added 250,000+ net new outlets and nearly 600,000 new coolers.
- Limited substitutability: For many restaurant and fast-food partnerships (McDonald’s since 1955), Coca-Cola is the exclusive beverage provider. These contracts create long-term, predictable revenue streams.
For investors, this pricing power means revenue can grow even when unit volumes are flat, a critical factor when forecasting revenue for a valuation model.
The Secret Sauce: Concentrates
As I mentioned at the beginning, soda, as we know it, is not the primary revenue source for this beverage giant. While Coca-Cola has made considerable strides in the beverage industry and sells 2.2 billion products daily, only 42% of its revenue comes from finished beverages like cans or bottles. The bulk 58% comes from concentrates. Surprise! Surprise!
This strategy was born in 1899 when Coca-Cola shifted to selling syrup concentrates to bottlers. The company sells pre-flavored mixtures mixed with water and carbonation to produce hundreds of servings. Bottlers handle production, packaging, and distribution, while Coca-Cola controls branding and marketing.
What makes this model so effective? Shipping concentrates, which exclude water (80% of most beverages), drastically reduces costs. Also, concentrates yield 60-80% gross margins, compared to 30-40% for finished products.
This franchise model saves costs and ensures that Coca-Cola remains the dominant force in beverage branding. The company has the largest advertising budget in the beverage industry, focusing on creating memorable connections with consumers.
A Financial Powerhouse
Despite these challenges, Coca-Cola remains financially world-class. Using my World Class Benchmarking scorecard, the company ranks in the top 20% of its sector in terms of profitability and growth.
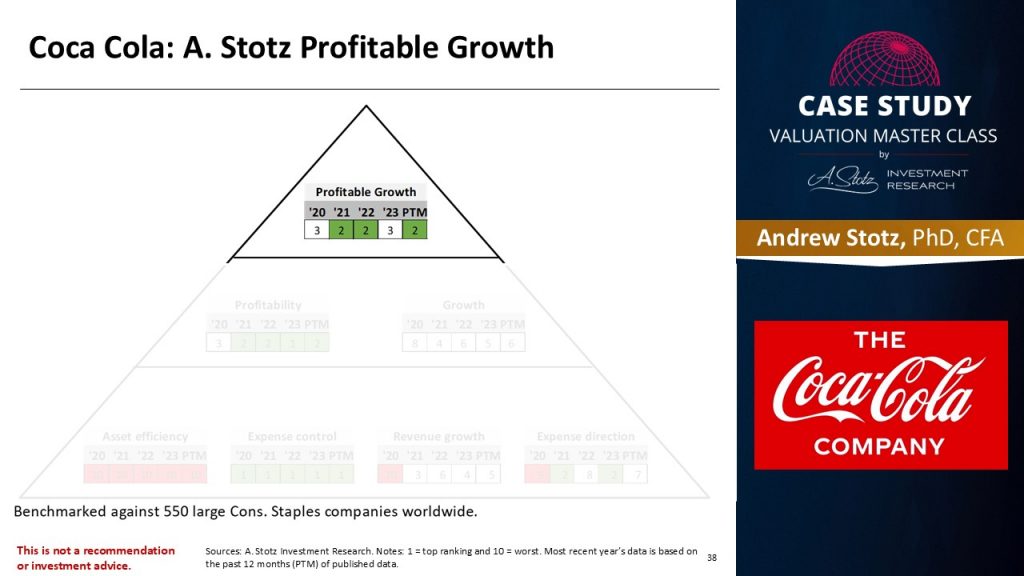
Its high net profit margin shows the efficiency of its cost structure and focus on high-margin segments like concentrates. Besides, even with slow revenue growth, emerging markets and non-soda segments offer Coca-Cola new opportunities.
How Does Coca-Cola Compare to PepsiCo?
The most common comparison for Coca-Cola investors is PepsiCo (NYSE: PEP). While both are beverage giants, their business models differ significantly:
| Metric | Coca-Cola (KO) | PepsiCo (PEP) |
|---|---|---|
| Annual Revenue | ~$47.7B | ~$91B |
| Net Profit Margin | ~23% | ~10% |
| Business Model | Pure-play beverages (concentrate-heavy) | Beverages + Frito-Lay snacks (50/50 split) |
| Gross Margin | ~62% | ~55% |
| Revenue CAGR (2015–2024) | ~Flat to low single digits | Low single digits |
| P/E Ratio | ~26x | ~22x |
| Dividend Streak | 60+ years of increases | 50+ years of increases |
Coca-Cola’s higher profit margins reflect the asset-light concentrate model, while PepsiCo’s larger top line comes from Frito-Lay (snack foods), which carries lower margins but provides diversification beyond beverages.
From a valuation perspective, the question is whether Coca-Cola’s higher margins justify its premium P/E multiple, or whether PepsiCo’s revenue diversification makes it the safer long-term bet. Warren Buffett’s answer has been clear: Berkshire Hathaway has held KO since 1988. For more on that thesis, see our analysis: Should Warren Buffett Sell Coca-Cola After 34 Years?
How Would You Value Coca-Cola Stock?
Understanding Coca-Cola’s business model is the first step. The second is choosing the right valuation method.
Why DDM works for Coca-Cola?
Coca-Cola has paid and increased its dividend for 60+ consecutive years, making it a classic Dividend Discount Model candidate. The stable, predictable dividend policy means dividends closely reflect the company’s cash-generating capacity.
A simplified DDM approach for KO:
- Current dividend per share: ~$2.00 (2025 estimate)
- Expected dividend growth rate (g): 3-5% annually (aligned with historical trend and pricing power)
- Cost of equity (ke): 7-9% (based on risk-free rate + beta x equity risk premium)
- Gordon Growth Model: Intrinsic value = D1 / (ke – g) = $2.06 / (0.08 – 0.04) = ~$51.50
This simplified model suggests KO’s intrinsic value is sensitive to the spread between the cost of equity and the growth rate, a common challenge with DDM. For a more robust analysis, a two-stage model that assumes higher near-term growth fading to a terminal rate would be more appropriate.
Alternative approaches:
- The FCFF model works if you want to capture the impact of Coca-Cola’s moderate debt load (debt-to-equity ~1.7x). Discount unlevered free cash flows at WACC.
- Relative valuation using P/E and EV/EBITDA multiples relative to consumer staples peers provides a market-based sanity check.
The key revenue forecasting risk with Coca-Cola is assuming pricing power can continue indefinitely in a market with rising health awareness, sugar taxes, and private-label competition.
Ready to advance?
If you already understand DDM, FCFF, and relative valuation but want deeper practical valuation skills, the Advancer Program helps mid-career professionals sharpen their methodology and stand out for promotions or lateral moves into investment roles.
Challenges and Opportunities
Coca-Cola may be a beverage giant, but it has its fair share of hurdles. For instance, with a net profit margin of 23% (compared to Pepsi’s 10%), there’s little room for growth.
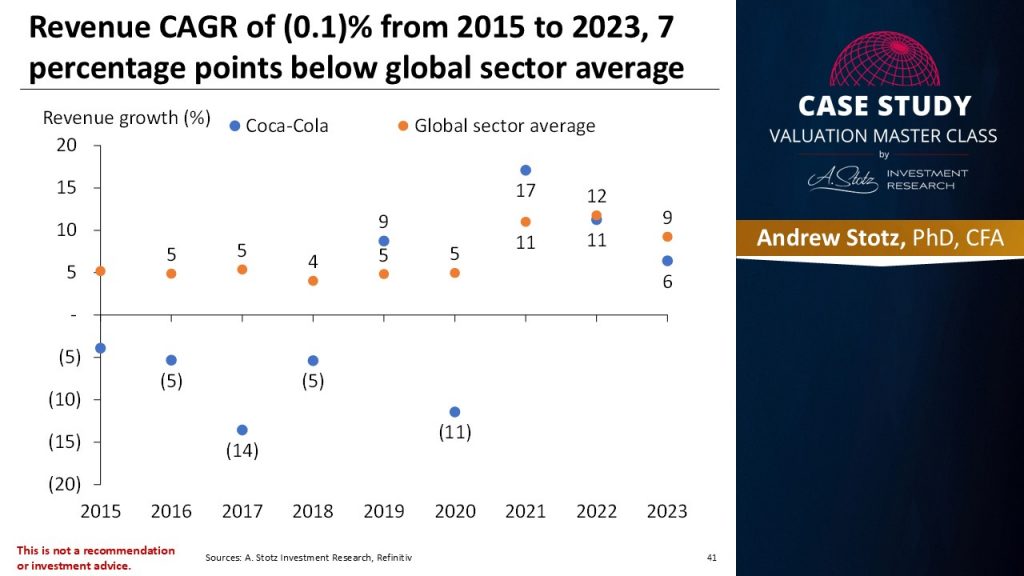
Between 2015 and 2023, Coca-Cola’s revenue compound annual growth rate (CAGR) was almost flat, highlighting the challenge of growing in a saturated market.
Further, with a price-to-earnings (P/E) ratio of 26, Coca-Cola isn’t cheap, indicating potential underperformance compared to its peers.
Key Risks for Coca-Cola Investors
Beyond the challenges already noted:
- Sugar taxes and regulation: Countries including the UK, Mexico, and several US cities have imposed taxes on sugary beverages. As these expand, they pressure both volume and margins on carbonated soft drinks.
- Currency exposure: With operations in 200 countries, Coca-Cola faces significant foreign exchange risk. In 2024, currency headwinds reduced reported revenue growth by approximately 3 percentage points.
- ESG and plastic waste: Coca-Cola has been ranked the world’s top plastic polluter in multiple audits. Regulatory and reputational costs from packaging sustainability could increase capital expenditure requirements.
- Market saturation in developed markets: North America generates over a third of revenue, but per-capitaCapEx vs Depreciation: Key Differences, Formula & Examples consumption is declining. Growth increasingly depends on emerging markets where political and economic risks are higher.
Key Takeaways: Coca-Cola’s Valuation Drivers
Coca-Cola’s secret to success isn’t just its fizzy drinks but its adaptability and strategic focus on concentrates. By repositioning its business model, embracing diversification, and targeting emerging markets, Coca-Cola stays ahead in these changing times.
![]()
Summary of Coca-Cola’s revenue drivers:
- Concentrates (58% of revenue): The real profit engine, with 60-80% gross margins. Coca-Cola sells pre-flavored syrup; bottlers handle production and distribution.
- Pricing power: 11% price/mix growth in 2024 demonstrates the ability to raise prices without losing volume, critical for a company with flat unit growth.
- Diversification: Costa Coffee, Fairlife, Topo Chico, BodyArmor, and Coca-Cola Zero Sugar address the shift away from sugary drinks.
- Global distribution: 33 million customer outlets with 14 million coolers create a physical moat that competitors can’t easily replicate.
- Brand value: $106 billion brand value supports premium pricing and consumer loyalty across 200 countries.
For a different perspective on Coca-Cola’s profitability, see our earlier case study: For Every Dollar of Coca-Cola You Buy, a Quarter Goes to Profit.
To learn more about evaluating top companies like Coca-Cola, download my Global Stock Tracker for free.
Frequently Asked Questions About Coca-Cola’s Revenue and Valuation
How does Coca-Cola make most of its revenue?
Coca-Cola earns 58% of its revenue from selling concentrates and syrups to bottling partners, not from selling finished beverages. Bottlers mix the concentrate with water and carbonation, then handle packaging and distribution. This franchise model allows Coca-Cola to earn gross margins of 60-80% on concentrates versus 30-40% on finished products, making it one of the most profitable companies in consumer staples.
How much revenue does Coca-Cola make per day?
Coca-Cola’s trailing twelve-month revenue (through Q3 2025) is approximately $47.7 billion, which works out to roughly $130 million per day. The company sells approximately 2.2 billion servings of beverages daily across 200 countries and 500+ brands.
Is Coca-Cola a good stock to value using the Dividend Discount Model?
Yes. Coca-Cola is a classic DDM candidate because it has paid and increased its dividend for 60+ consecutive years. The stable, predictable dividend policy means dividends closely reflect the company’s true cash-generating capacity. A Gordon Growth Model using a 3-5% dividend growth rate and 7-9% cost of equity provides a reasonable baseline valuation, though a two-stage model is more appropriate for capturing near-term growth differences.
What is Coca-Cola’s profit margin compared to PepsiCo’s?
Coca-Cola’s net profit margin is approximately 23%, compared to PepsiCo’s ~10%. The difference reflects Coca-Cola’s asset-light concentrate model versus PepsiCo’s more capital-intensive combined beverages-and-snacks business. Both are dividend aristocrats with 50+ years of consecutive dividend increases.
Does Coca-Cola own Pepsi?
No. Coca-Cola and PepsiCo are entirely separate, publicly traded companies that compete in the global beverage market. Coca-Cola (NYSE: KO) focuses primarily on beverages, while PepsiCo (NYSE: PEP) operates both a beverage division and the Frito-Lay snack food division. Coca-Cola holds approximately 45% of the US carbonated soft drink market compared to PepsiCo’s approximately 26%.
Why is Coca-Cola’s revenue growth flat despite being so profitable?
Between 2015 and 2024, Coca-Cola’s revenue CAGR was nearly flat because of two factors: refranchising (transferring bottling operations to partners, which reduced top-line revenue but improved margins) and declining sugary beverage consumption in developed markets. The company has compensated with pricing power, emerging market expansion, and diversification into coffee, dairy, and sports drinks.
Where can I learn to build a complete valuation model on a company like Coca-Cola?
The Valuation Master Class Boot Camp teaches how to build complete financial models using real company data. Participants analyze companies across different sectors, apply DDM, FCFE, and FCFF methods, and present their valuations. The program is designed for career starters, mid-career advancers, and career switchers.
Switching into finance from another field?
If you are transitioning into finance and need structured credibility building, our Switcher Program is designed for career changers who need to build practical valuation skills fast, even without a finance background.
Ready to Take the Next Step?
Join 5,000+ finance professionals who’ve leveled up with Valuation Master Class.