Nike Valuation: Is the Brand’s Dominance Enough to Justify Its Premium?
What Is Nike Worth? A Valuation Snapshot
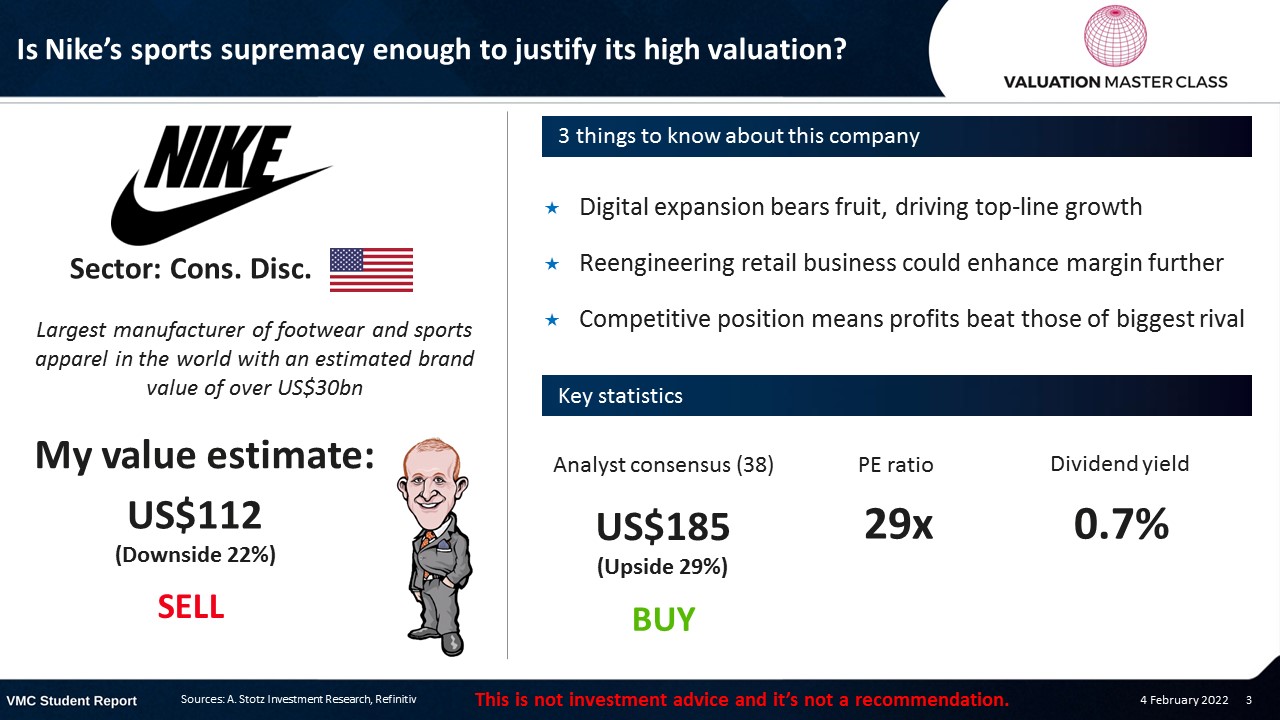
Nike (NYSE: NKE) is the world’s largest sportswear company, with a market capitalization of approximately $95 billion as of early 2026. But is it overvalued? In 2021, Nike delivered an astonishing return on invested capital (ROIC) of 69%, dwarfing Adidas at roughly half that level. By 2025, Nike’s ROIC had fallen to approximately 15% as revenue declined 10% year-over-year and the company underwent a CEO transition.
This Nike valuation case study, originally published by Dr. Andrew Stotz at Valuation Master Class, analyzes whether Nike’s competitive advantages, brand power, direct-to-consumer strategy, and global scale are durable enough to sustain a premium stock valuation. Below is a summary of Nike’s key financial metrics at the time of analysis and where they stand today.
| Metric | 2021 (Original Analysis) | 2025 (Updated) |
|---|---|---|
| Revenue | $44.5 billion | $46.3 billion (FY2025) |
| Revenue CAGR (5-year) | 6.8% | ~1% (FY2020-FY2025) |
| ROIC | 69% | ~15% |
| ROE | 37% | ~33% |
| Gross Margin | ~46% | ~44% |
| Nike Direct (% of revenue) | 35% | ~42% |
| P/E Ratio | ~38x | ~38x |
| Market Cap | ~$230 billion | ~$95 billion |
| Brand Value (Brand Finance) | ~$33 billion | $29.4 billion |
The contrast is stark: Nike’s valuation multiple has stayed elevated even as its profitability and growth metrics deteriorated. This makes the company valuation methods used to analyze Nike all the more important, and the original 2021 analysis provides a valuable benchmark for understanding how fundamentals shift over time.
Starting your finance career?
Our Starter Program gives you the foundational skills to land your first analyst role — DCF valuation, financial modeling, and interview prep included.
Highlights:
- Digital expansion bears fruit, driving top-line growth
- Reengineering the retail business could enhance margins further
- Competitive position means profits beat those of the biggest rival
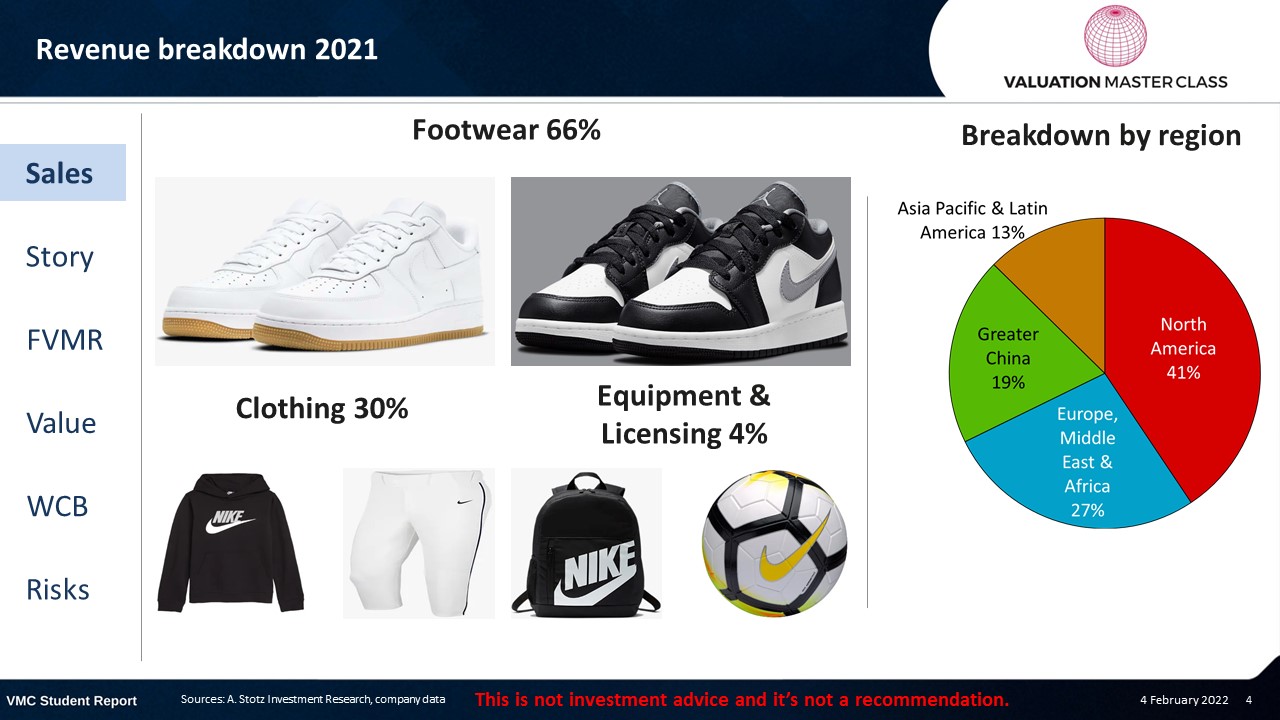
Nike’s Revenue Breakdown 2021
Price Turned Bearish
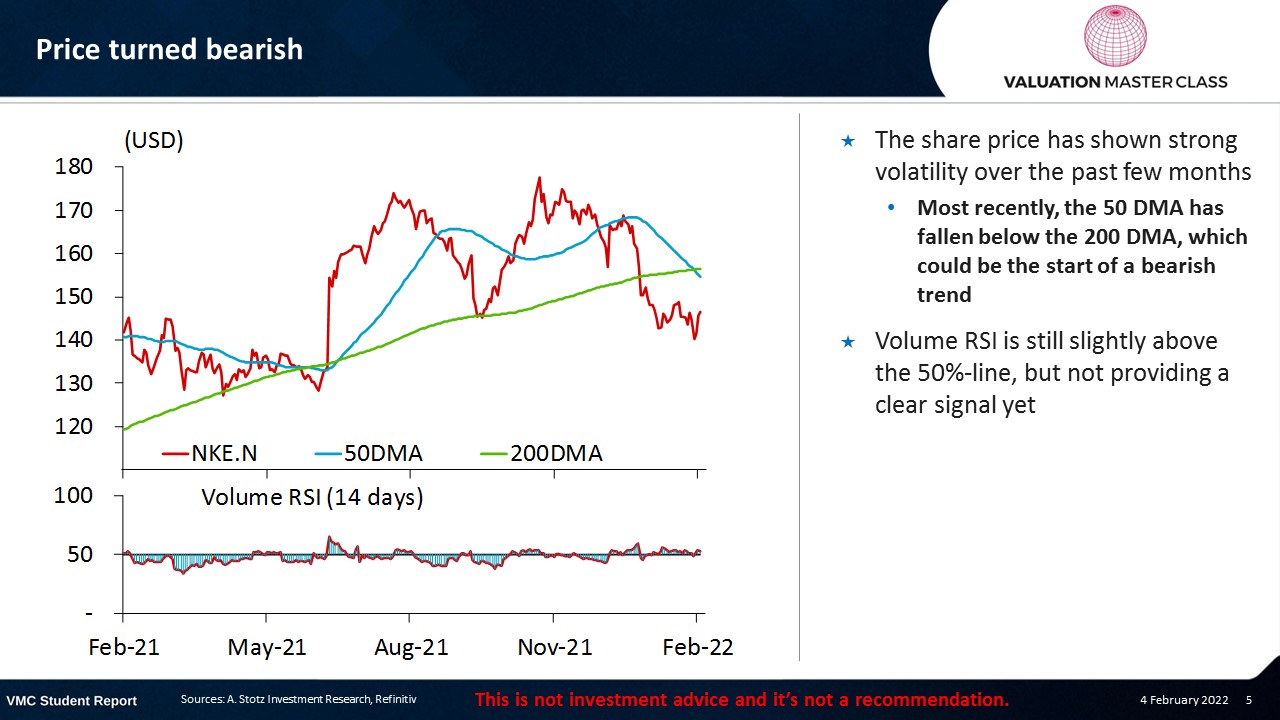
- The share price has shown strong volatility over the past few months
- Most recently, the 50 DMA has fallen below the 200 DMA, which could be the start of a bearish trend
- Volume RSI is still slightly above the 50%-line, but not providing a clear signal yet
Digital Expansion Bears Fruit, Driving Top-Line Growth
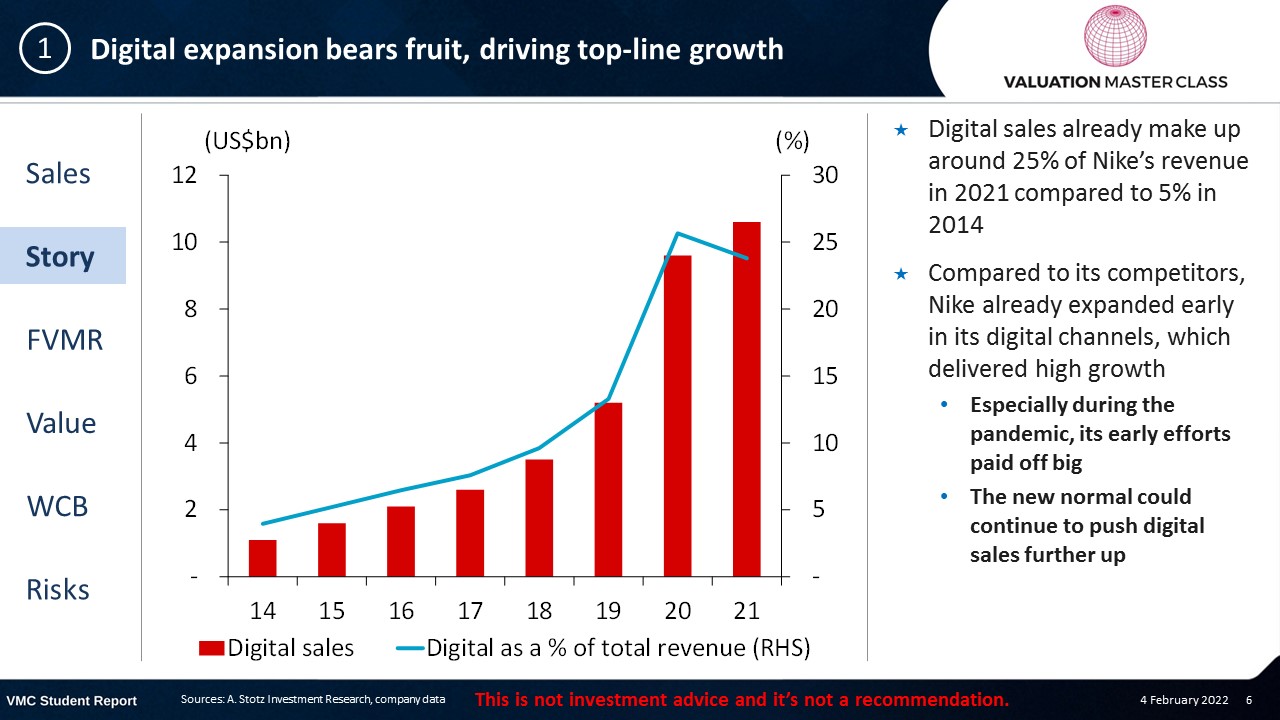
- Digital sales already make up around 25% of Nike’s revenue in 2021, compared to 5% in 2014
- Compared to its competitors, Nike already expanded early in its digital channels, which delivered high growth
- Especially during the pandemic, its early efforts paid off big
- The new normal could continue to push digital sales further up
Digital Penetration Is Part of Its Strategy Shift
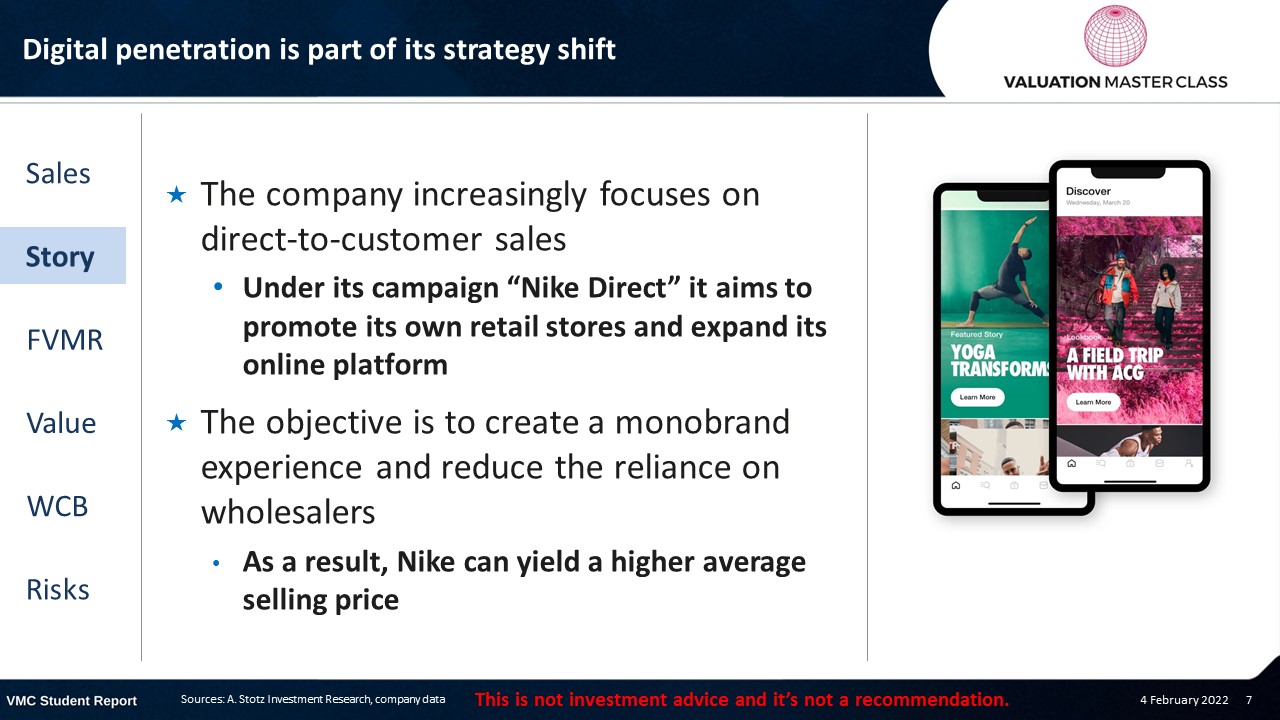
- The company increasingly focuses on direct-to-customer sales
- Under its campaign “Nike Direct,” it aims to promote its own retail stores and expand its online platform
- The objective is to create a monobrand experience and reduce the reliance on wholesalers
- As a result, Nike can yield a higher average selling price
2025 Update: The DTC Strategy Reversal
Nike’s ambition to reach 50% direct-to-consumer revenue by 2025 has been abandoned. Under Elliott Hill, the company is actively rebuilding wholesale partnerships that were cut under the previous DTC-heavy strategy.
In Q2 FY2026, wholesale revenues rose 8% to $7.5 billion while Nike Direct sales fell 8% to $4.6 billion. This deliberate rebalancing reflects a pragmatic recognition that the DTC push went too far, Nike lost critical shelf space at retailers like Foot Locker and Dick’s Sporting Goods, and online-only sales could not compensate.
The strategic lesson for valuation analysts: when modeling Nike’s future revenue mix, do not assume a linear DTC ramp. The optimal channel strategy appears to be an omnichannel approach that balances direct and wholesale, not a DTC-dominated model.
Reengineering Retail Business Could Enhance Margin Further
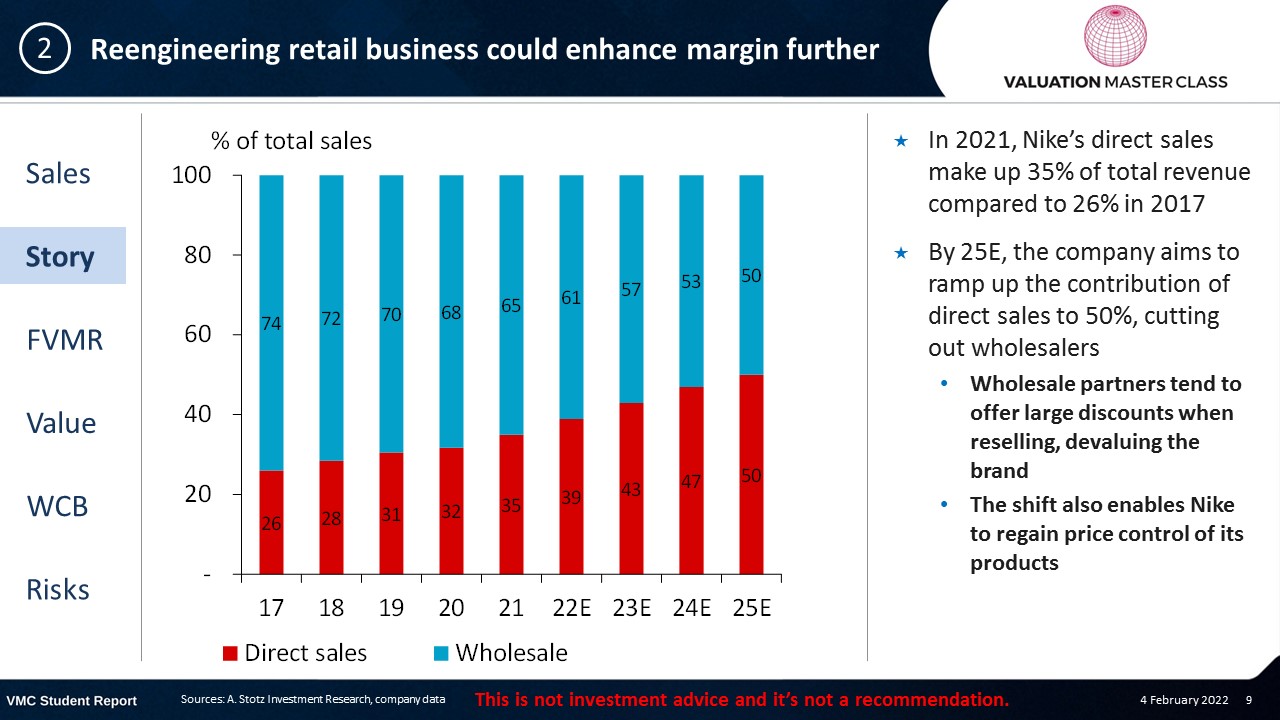
- In 2021, Nike’s direct sales made up 35% of total revenue compared to 26% in 2017
- By 25E, the company aims to ramp up the contribution of direct sales to 50%, cutting out wholesalers
- Wholesale partners tend to offer large discounts when reselling, devaluing the brand
- The shift also enables Nike to regain price control of its products
Cutting Out the Middleman Should Result in Margin Expansion
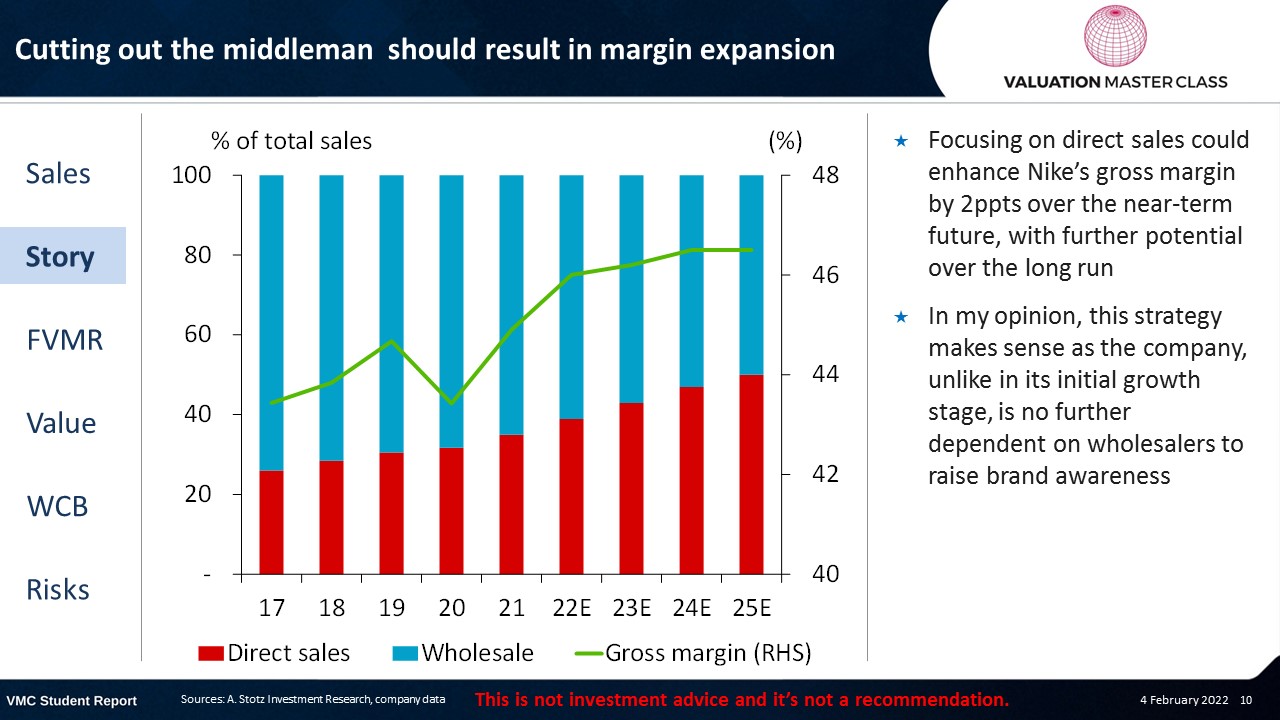
- Focusing on direct sales could enhance Nike’s gross margin by 2ppts over the near-term future, with further potential over the long run
- In my opinion, this strategy makes sense as the company, unlike in its initial growth stage, is no longer dependent on wholesalers to raise brand awareness
Competitive Position Means Profits Beat Those of the Biggest Rival
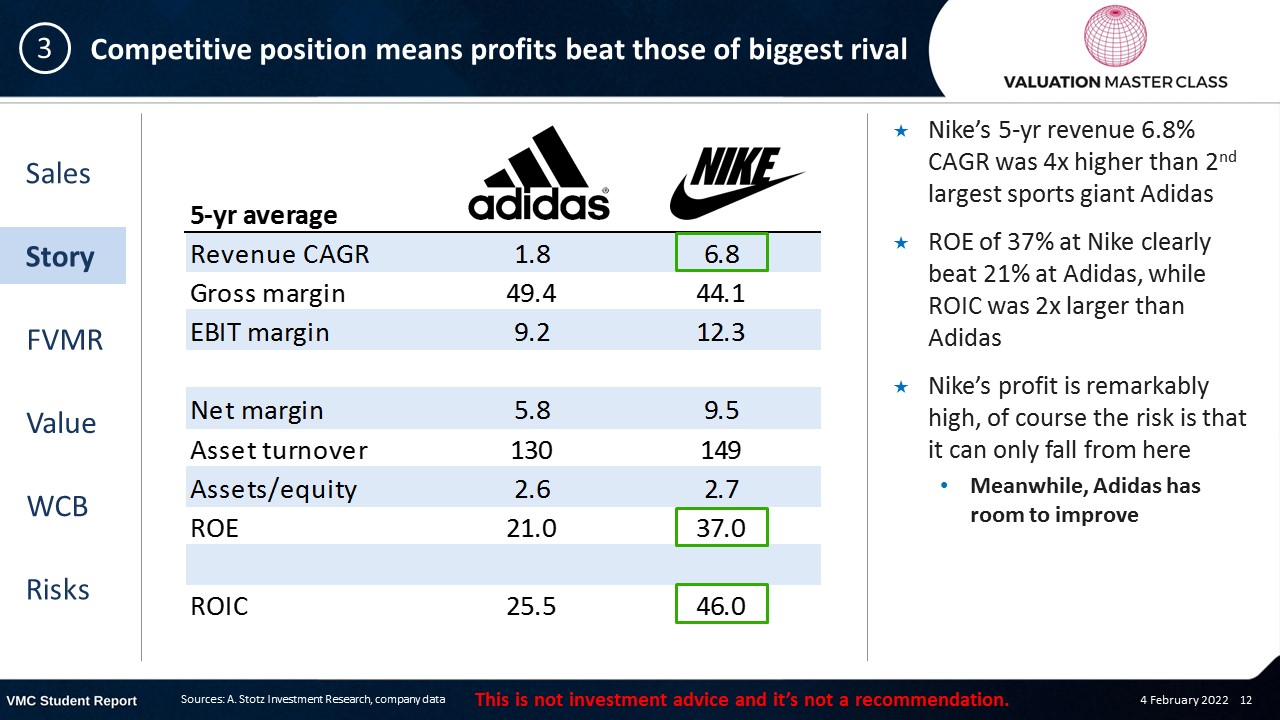
- Nike’s 5-yr revenue 6.8% CAGR was 4x higher than the 2nd largest sports giant, Adidas
- ROE of 37% at Nike clearly beat 21% at Adidas, while ROIC was 2x larger than Adidas
- Nike’s profit is remarkably high; of course, the risk is that it can only fall from here
- Meanwhile, Adidas has room to improve
2025 Update: Has Nike’s Revenue Growth Stalled?
Nike’s revenue growth trajectory has shifted dramatically since 2021. Full-year FY2025 revenue came in at $46.3 billion, down 10% year-over-year from $51.4 billion in FY2024. The 5-year CAGR from FY2020 to FY2025 has compressed to approximately 1%, a far cry from the 6.8% rate that characterized the high-growth era.
The key drivers of the slowdown include:
- China headwinds: Geopolitical tensions and local competition from brands like Anta and Li Ning reduced Nike’s growth in Greater China
- Inventory overhangs: Aggressive markdowns to clear excess stock compressed margins
- DTC strategy retreat: Under former CEO John Donahue, Nike cut wholesale partnerships to push direct-to-consumer sales. This backfired as the company lost shelf space at key retailers
- New CEO turnaround: Elliott Hill, a Nike veteran, took over in October 2024 and is rebuilding wholesale relationships, refocusing on product innovation, and implementing his “Win Now” strategy
For valuation purposes, the critical question is whether Nike’s revenue growth can re-accelerate under Hill’s leadership or whether the 6.8% CAGR era was a peak that will not return.
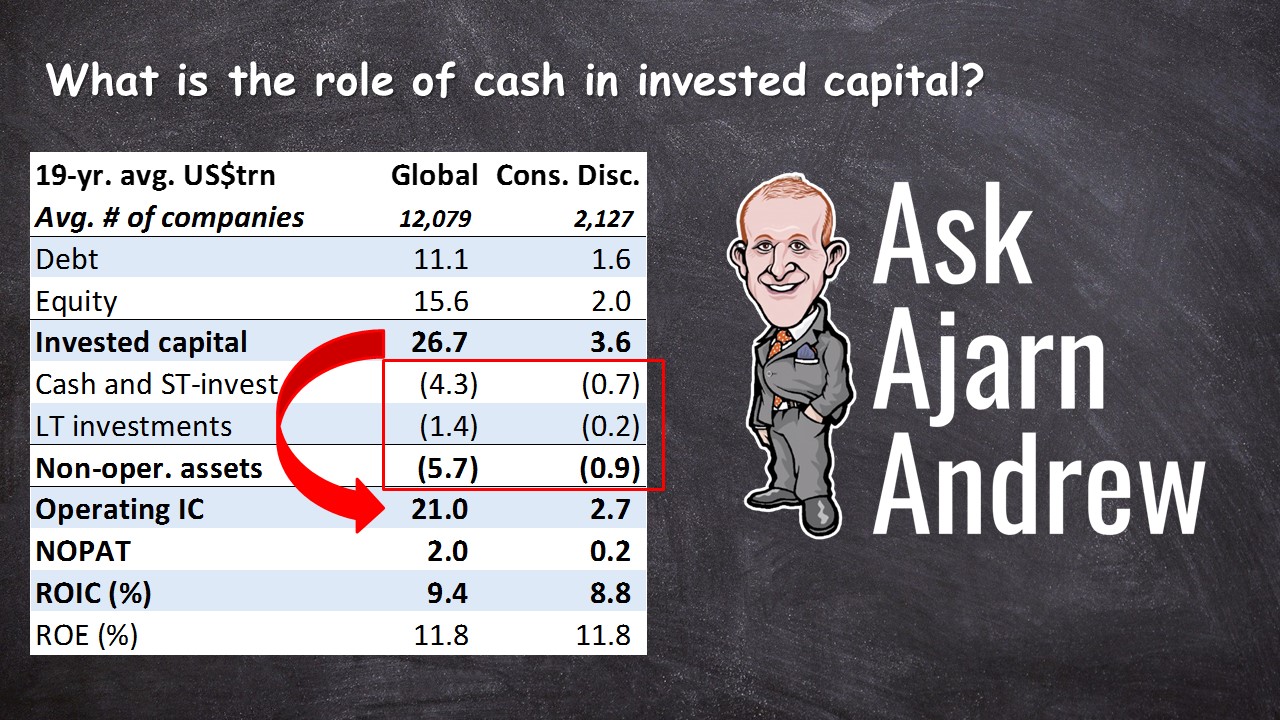
What Is the Role of Cash in Invested Capital?
Massive Value Creation Is Already Priced In
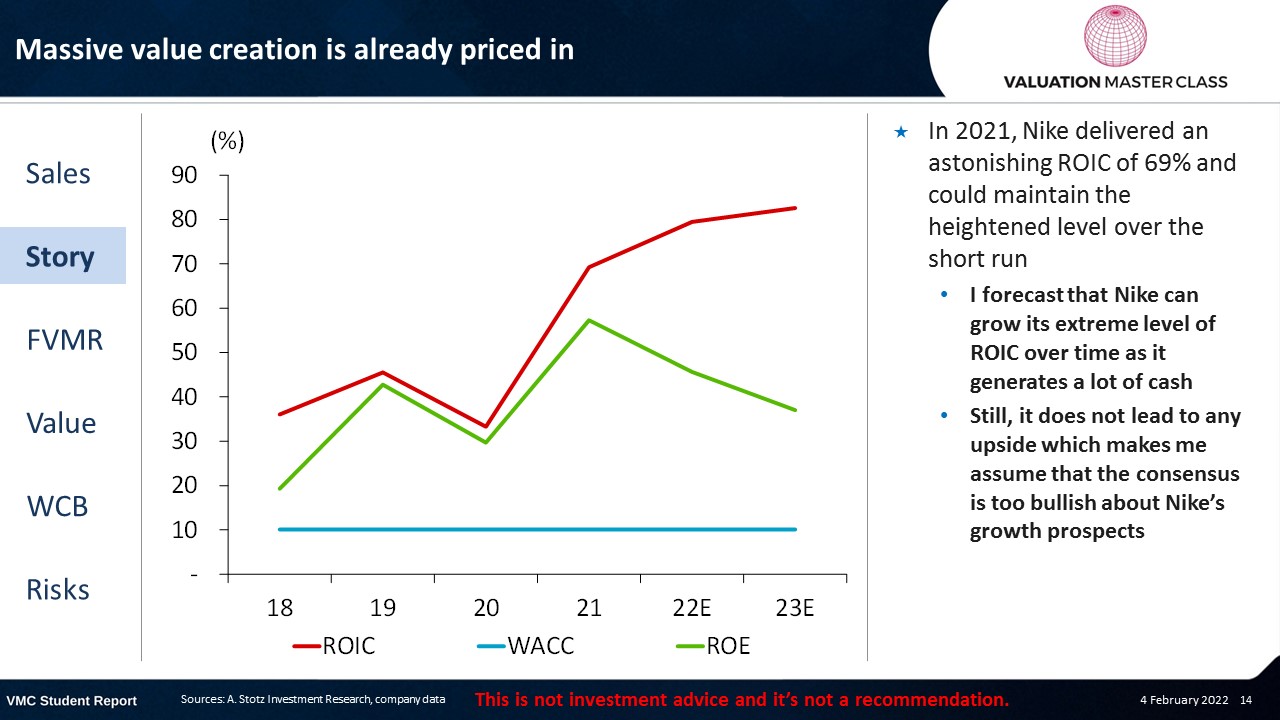
- In 2021, Nike delivered an astonishing ROIC of 69% and could maintain the heightened level over the short run
- I forecast that Nike can grow its extreme level of ROIC over time as it generates a lot of cash
- Still, it does not lead to any upside, which makes me assume that the consensus is too bullish about Nike’s growth prospects
What Is Nike’s ROIC and Why Does It Matter for Valuation?
Nike’s ROIC has been one of the most scrutinized metrics in sportswear equity analysis. In 2021, Nike posted an ROIC of approximately 69%, meaning for every $1.00 of capital invested in the business, Nike generated $0.69 in after-tax operating profit. This was extraordinary by any standard and roughly 2x the ROIC of Adidas.
A company creates shareholder value when its ROIC exceeds its weighted average cost of capital (WACC). In 2021, Nike’s WACC was estimated at approximately 8-10%, meaning Nike was creating massive value; every dollar deployed earned roughly 7x its cost of capital.
However, the sustainability of a 69% ROIC is questionable for any company. In valuation theory, exceptionally high returns on capital tend to fade toward the cost of capital over time as competition increases, markets mature, and growth slows. The question for Nike’s valuation was always: how fast would ROIC fade?
Nike ROIC History (FY2020-FY2025)
| Fiscal Year | ROIC | Invested Capital ($B) | NOPAT ($B) |
|---|---|---|---|
| FY2020 | ~13% | $19.1 | ~$2.5 |
| FY2021 | ~69% | — | — |
| FY2022 | ~26% | — | — |
| FY2023 | ~24% | — | — |
| FY2024 | ~23% | $22.1 | — |
| FY2025 | ~15% | $19.9 | — |
The 2021 ROIC spike was partly driven by pandemic-era revenue recovery against a relatively low capital base. As invested capital normalized and profitability declined, ROIC reverted toward a more sustainable level. The current ~15% ROIC still exceeds Nike’s cost of capital, meaning the company continues to create value, but the margin of safety has narrowed considerably.
Ready to advance?
The Advancer Program helps mid-career professionals sharpen their valuation and equity research skills and stand out for promotions or lateral moves into investment roles.
How Does Nike’s Valuation Compare to Adidas’s?
One of the most common questions investors ask is whether Nike or Adidas represents better value. Here is a side-by-side comparison using the most recent available data:
| Metric | Nike (NKE) | Adidas (ADDYY) |
|---|---|---|
| Market Cap (Feb 2026) | ~$95 billion | ~$42 billion |
| Revenue (Latest FY) | $46.3 billion | ~$25 billion |
| Revenue Growth (YoY) | -10% | +12% |
| Gross Margin | ~44% | ~51% |
| ROIC (Latest) | ~15% | ~10-12% |
| ROE (Latest) | ~33% | ~21% |
| P/E Ratio (Trailing) | ~38x | ~40x |
| Brand Value (2025) | $29.4 billion | ~$16 billion |
| EPS Growth (FY Projected) | -47% | +83% |
Key takeaways from this comparison:
- Nike is larger but shrinking; Adidas is smaller but growing: Nike’s FY2025 revenue declined 10% while Adidas grew 12%. This divergence is unusual and reflects Nike’s strategic transition under new leadership.
- Nike has higher ROIC and ROE despite the decline: Even at ~15%, Nike’s ROIC exceeds Adidas’s. Nike’s business model, even in a downturn, generates more profit per dollar of invested capital.
- Both trade at premium multiples: Neither stock is “cheap.” Nike’s ~38x P/E and Adidas’s ~40x P/E both imply significant future earnings growth. The question is which company’s growth expectations are more realistic.
- Adidas has better near-term momentum: With 83% projected EPS growth versus Nike’s -47% decline, Adidas is the momentum play. But Nike’s competitive moat, analyzed through Porter’s Five Forces, remains deeper due to superior brand equity, athlete endorsements, and global distribution infrastructure.
For a deeper comparison methodology, see how we analyzed another consumer brand rivalry: PepsiCo’s profit margin compared to Coca-Cola.
Common Mistakes When Valuing Nike
Valuing a global consumer brand like Nike presents specific challenges. Here are the mistakes analysts most frequently make:
1. Using Peak ROIC in Terminal Value Calculations
Nike’s 69% ROIC in 2021 was an anomaly driven by pandemic recovery dynamics. Using this figure or anything close to it in a DCF terminal value calculation would dramatically overstate Nike’s intrinsic value. A more conservative approach uses a normalized ROIC of 20-25%, which reflects Nike’s long-term capital efficiency before the pandemic distortion.
2. Ignoring Channel Mix in Revenue Forecasting
Nike Direct sales carry higher gross margins (~60%) than wholesale (~40%), but they also require higher SGA spending on marketing, fulfillment, and technology. Analysts who model DTC revenue growth without adjusting for these higher costs overestimate operating margin expansion.
3. Treating Nike Like a Growth Stock
At ~38x trailing earnings, Nike is priced for growth, but FY2025 revenue declined 10%. The risk is that Nike’s premium multiple reflects brand perception rather than current financial reality. A margin-of-safety approach would model multiple compression scenarios alongside revenue recovery.
4. Overlooking Currency Exposure
Nike generates approximately 60% of revenue outside the United States. A strong U.S. dollar can reduce reported revenue by several billion dollars even when local-currency growth is healthy. Always model Nike’s revenue in constant currency terms before converting.
5. Underweighting Competitive Threats
Adidas is not Nike’s only competitor. Brands like On Running (growing 30%+ annually), Hoka (owned by Deckers Brands), and Chinese domestic brands (Anta, Li Ning) are taking market share in key categories. A proper valuation should stress-test Nike’s market share assumptions.
How to Value Nike Yourself: A Step-by-Step Framework
Want to perform your own Nike valuation? Here is the framework Dr. Andrew Stotz uses at Valuation Master Class:
Step 1: Analyze the Business Model: Break down Nike’s revenue by segment (footwear, apparel, equipment), channel (direct, wholesale), and geography (North America, EMEA, Greater China, APLA). Understand which segments drive growth and margins.
Step 2: Benchmark Against Peers: Compare Nike’s financial metrics (ROIC, ROE, gross margin, revenue growth) against Adidas, Puma, Under Armour, and On Running. This reveals whether Nike’s premium is justified.
Step 3: Forecast Revenue and Margins: Build a 5-year revenue forecast incorporating channel mix shifts, geographic growth assumptions, and pricing power. Model gross margin and operating margin separately, accounting for DTC vs wholesale economics.
Step 4: Calculate WACC: Determine Nike’s cost of equity (using CAPM or a comparable methodology) and cost of debt. Weight them based on Nike’s target capital structure.
Step 5: Build a DCF Model: Discount projected free cash flows at Nike’s WACC. Apply a terminal value using either a perpetuity growth model (with a 3-4% terminal growth rate, as used in the original analysis) or an exit multiple approach.
Step 6: Sense-Check with Multiples Cross-reference your DCF output with relative valuation P/E, EV/EBITDA, and EV/Revenue versus peers. If your DCF suggests Nike is worth $150/share but peers trade at 25x earnings, investigate the discrepancy.
This is the same methodology taught in the Valuation Master Class bootcamp, applied to real companies with real financial data.
Switching into finance from another field?
Our Switcher Program is designed for career changers who need to build credibility fast — no finance background required.
Final Verdict: Is Nike Overvalued or Undervalued?
Nike’s valuation remains controversial. The company still commands one of the strongest brands in the world and continues to generate returns above its cost of capital.
However, the sharp decline in revenue growth and ROIC from peak levels raises questions about how much of Nike’s future success is already priced into the stock.
Investors who believe Nike can restore mid-single-digit revenue growth and maintain ROIC above 20% may view the current valuation as justified. More conservative analysts may prefer to wait for clearer signs of operational recovery.
Ultimately, Nike’s valuation depends on whether its competitive advantages in brand strength, innovation, and global distribution can continue to outperform competitors such as Adidas and emerging sportswear brands.
DISCLAIMER: This content is for information purposes only. It is not intended to be investment advice. Readers should not consider statements made by the author(s) as formal recommendations and should consult their financial advisor before making any investment decisions. While the information provided is believed to be accurate, it may include errors or inaccuracies. The author(s) cannot be held liable for any actions taken as a result of reading this article.
Frequently Asked Questions About Nike’s Valuation
What is Nike’s current valuation?
As of early 2026, Nike (NKE) has a market capitalization of approximately $95 billion and trades at a trailing P/E ratio of roughly 38x. This places Nike at a premium to the broader consumer discretionary sector. Nike’s enterprise value is approximately $97 billion when including net debt. Whether this valuation is justified depends on whether Nike can return to mid-single-digit revenue growth and restore ROIC above 20% under CEO Elliott Hill’s turnaround plan.
What is Nike’s ROIC?
Nike’s return on invested capital was approximately 15% in FY2025, down significantly from a peak of 69% in FY2021. Even at this lower level, Nike’s ROIC exceeds its estimated WACC of 8-10%, meaning the company still creates shareholder value. However, the declining trajectory has compressed the value creation spread and is a key risk for long-term investors. Historically, Nike’s normalized ROIC has ranged between 20-30%.
How does Nike’s valuation compare to Adidas’s?
Nike trades at a trailing P/E of approximately 38x versus Adidas at roughly 40x. However, Adidas is growing revenue at 12% while Nike’s revenue declined 10% in FY2025. Nike has a higher ROIC (~15% vs ~10-12%) and ROE (~33% vs ~21%), but Adidas has stronger near-term earnings momentum with projected EPS growth of 83%. The “better value” depends on your investment horizon: Nike for long-term moat believers, Adidas for near-term turnaround momentum.
Is Nike overvalued in 2026?
At ~38x trailing earnings, Nike is priced above its 5-year average P/E of approximately 34x and significantly above the luxury/consumer industry average of ~21x. The premium implies Nike will return to strong earnings growth. If CEO Elliott Hill’s turnaround succeeds and Nike restores mid-single-digit revenue growth with ROIC above 20%, the current valuation could be justified. If the turnaround stalls, there is meaningful downside risk from multiple compressions.
What is Nike’s competitive moat?
Nike’s competitive advantages include the world’s strongest apparel brand (Brand Strength Index of 94.7/100), exclusive athlete endorsement deals, a global distribution network spanning 190+ countries, significant R&D investment in footwear innovation, and a direct-to-consumer platform generating over $4.6 billion per quarter. These advantages create high barriers to entry, though competitors like On Running and Hoka are gaining share in key performance categories. A Porter’s Five Forces analysis helps quantify moat durability.
What happened to Nike’s stock price?
Nike’s stock declined approximately 30% in 2024, making it the second-worst performer among the 30 Dow Jones Industrial Average components. The stock fell an additional ~24% through early 2025 before stabilizing. The decline reflected slowing revenue growth, margin compression, inventory challenges, and the strategic uncertainty of a CEO transition. Nike’s market cap fell from approximately $230 billion in 2021 to roughly $95 billion by early 2026.
Where can I learn business valuation using real case studies like Nike?
Valuation Master Class teaches valuation through real-world case studies on companies like Nike, Coca-Cola, Tesla, and Disney. The program is designed by Dr. Andrew Stotz, a former number-one-ranked equity analyst, and covers DCF valuation, comparable company analysis, and financial modeling. Whether you are starting your finance career, switching from another field, or advancing to senior analyst roles, the Valuation Master Class bootcamp provides hands-on training with real company data.
Ready to Take the Next Step?
Join 5,000+ finance professionals who’ve leveled up with Valuation Master Class.