Overly Optimistic Revenue Forecasts: The #1 Valuation Mistake (and How to Avoid It)
What Is the #1 Valuation Mistake?
Overly optimistic revenue forecasts are the most common and damaging mistake in company valuation. Research on the 540 largest companies in Asia shows that analysts miss revenue forecasts by approximately 10% on average, with an estimated 15% optimistic bias. Since revenue is the foundation of every valuation model — driving profit margins, cash flows, and terminal value — an inaccurate revenue forecast makes the entire valuation unreliable. This article explains why revenue optimism happens, how often analysts get it wrong, and the practical steps you can take to build more accurate forecasts.
This is the first installment of Dr. Andrew Stotz’s Top 9 Valuation Mistakes series, based on decades of experience as a former #1-ranked equity analyst in Asia.
During my career, I built highly complex and detailed financial models early on as an analyst, but I later realized that the increased complexity surrounding such models rarely translates into increased accuracy. This series of articles is somewhat inspired by that revelation: I’m going to expand on the Top 9 Valuation Mistakes and reveal how you can avoid them. This is the first blog of that series on overly optimistic revenue forecasts.
Here’s the full list of Top 9 Mistakes.
The Top 9 Valuation Mistakes
- Overly optimistic revenue forecasts
- Underestimating expenses causing unrealistic profit forecasts
- Growing fixed assets slower than revenue
- Confusing growth with maintenance Capex
- Forecasting drastic changes in cash conversion cycle
- Underestimating working capital investment
- Valuing a stock using the calculated Beta
- Choosing an unreasonable cost of equity
- Not properly fading the return on invested capital
So, let’s get into it and talk about #1.
Starting your finance career?
Our Starter Program gives you the foundational skills to land your first analyst role — valuation, financial modeling, and interview prep included.
Why Are Revenue Forecasts So Often Wrong?
Analysts often make overly optimistic revenue growth forecasts. Below is a screenshot from my ValueModel for the company, Kingsmen Creatives Ltd. You can see that historically it had -2.5% revenue growth and then 0.6% revenue growth. The analysts have then forecasted growth of 20.0%, 20.0%, 25.0%, etc., which is significantly overly optimistic.
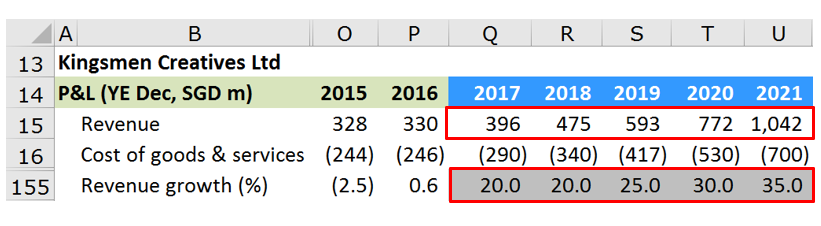
Fig. 1 Overly Optimistic Profit Forecasts
How Often Are Analysts Inaccurate with Their Forecasts?
To answer this, I’ll share my research, which encompasses ‘How accurate are analysts’ revenue forecasts in Asia?’ To be included in this research, the company had to have 10 years of actual data, and there must be at least 10 analysts covering the business. The result: 540 of the largest companies in Asia.
Here are the results of the research:
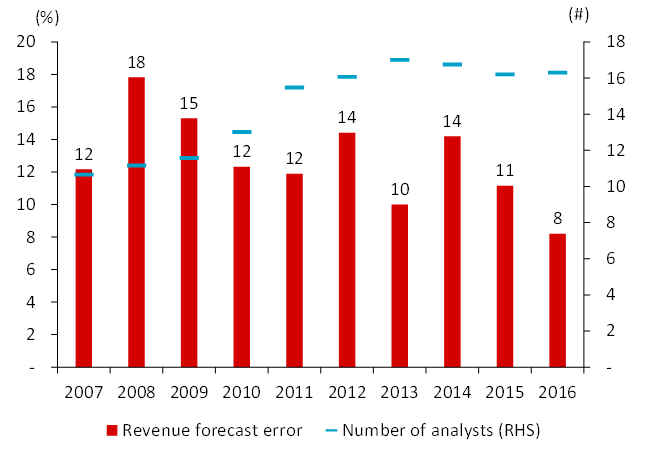
Fig. 2 Analysts Miss Revenue Forecasts by More Than 10%
The conclusion that we can see is that, on average, over the period, analysts were in error. This is an absolute error, not above or below, just an error. On average, it was about 10%.
What we can also see is that it seems like it’s getting more accurate as time goes on. But that can be deceiving. Usually, it gets more accurate when things are really stable, and then, things blow up. And when that happens, things are a mess.
I haven’t calculated the actual error from an above or below perspective. This is just an absolute error. I would estimate, in this case, that analysts were about 15% overly optimistic in their revenue forecast. Consensus can’t predict revenue for cyclical sectors. It’s easier for non-cyclical sectors.
What Does Academic Research Say About Analyst Forecast Bias?
The problem of overly optimistic forecasts is well-documented in academic literature. A landmark study by Pablo Fernandez at IESE Business School catalogued 80 common errors in company valuations performed by analysts, investment banks, and consultants — and errors in forecasting expected cash flows (driven by revenue assumptions) rank among the most frequent.
Several factors contribute to this systematic bias:
- Conflict of interest: Analysts employed by brokerage firms and investment banks face pressure to issue optimistic forecasts, which can generate trading volume and support client relationships. Research published in the Journal of Behavioral and Experimental Finance confirms that managers’ incentives directly influence analyst forecast optimism.
- Access to management: Analysts may shade forecasts upward to maintain access to company executives. Brown, Call, Clement, and Sharp (2015) found that analysts consider private communication with management critically important, creating an incentive not to publish bearish views.
- Asymmetric reactions: Evidence from behavioral finance shows analysts tend to underreact to negative information while overreacting to positive news, creating a persistent upward bias.
- Sentiment effects: During periods of high market sentiment, forecasts become even more optimistic, particularly for companies that are harder to value.
Understanding these structural biases is essential for any analyst building a discounted cash flow model or stock valuation. The bias isn’t random — it’s predictable, which means you can systematically guard against it.
Why Does This Happen?
“The S&P 500 will gain 30% this year since it was up 20% last year and 10% the year before.” You’ve probably met somebody who has said something like this, and what you’re going to find is that they usually are suffering from recency bias. The problem with recency bias is that we can all suffer from it. So be careful.
Recency bias is when you believe that what has happened recently will continue to be the case in the future. You’ll stay in stocks because it’s a boom market even though you acknowledge the high valuation. But, when making decisions about the future, avoid using yesterday as your only reference point.
Check out the chart below:
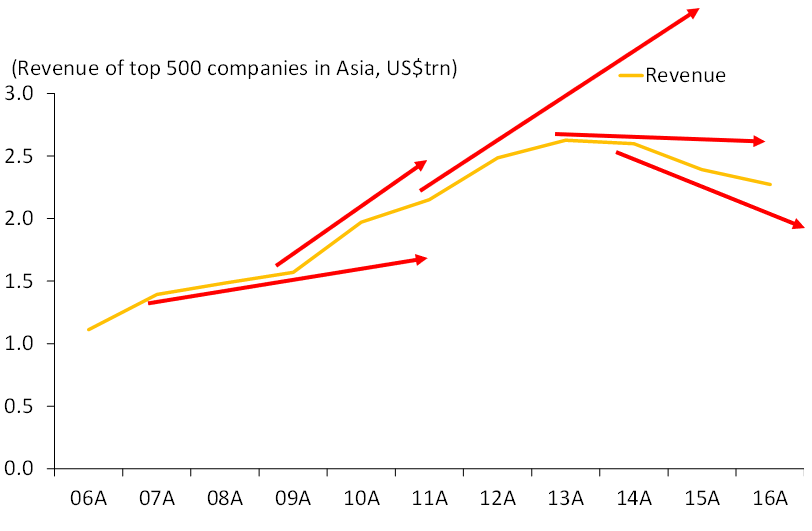
Fig. 3 Revenue Growth – Why It’s Important
As the red arrows demonstrate, depending on when you begin to examine revenue growth would provide completely different forecasts of revenue growth. And if you get the revenue direction wrong, it’s impossible to get the rest of your forecast right.
Other Cognitive Biases That Distort Revenue Forecasts
Recency bias is just one of several psychological traps that lead to overly optimistic forecasts. Here are three more that every equity analyst and valuation professional should watch for:
Anchoring bias. Once you see a company’s internal revenue target or a consensus estimate, your own forecast tends to anchor near that number — even if independent analysis would suggest something different. This is why it is critical to build your own revenue model before looking at consensus.
Confirmation bias. After forming an initial view on a company, analysts tend to seek out information that supports their thesis and discount contradictory evidence. If you believe a company will grow at 15%, you’ll naturally gravitate toward data points that confirm that view.
Survivorship bias. Analyst forecast accuracy studies often exclude companies that were delisted or went bankrupt. This means the “track record” of forecasting looks better than it actually is. When you include failures, the error rates increase significantly.
The practical solution is to build systematic checks into your forecasting process, something we cover in detail in the Valuation Master Class Boot Camp, where participants work through real company models with structured peer review.
Ready to advance?
The Advancer Program helps mid-career professionals sharpen their valuation skills and stand out for promotions or lateral moves into investment roles.
How Do I Avoid Making Overly Optimistic Forecasts?
Revenue is the most important item in valuation because all businesses start with revenue. But a lot of revenue research needs to happen outside of the figures in front of you.
When I was an analyst, I just sat behind my computer most of the time. I didn’t get these things until I got older. And as you get older, you want to understand the factors that drive revenue growth; from marketing and sale efficiency to customer satisfaction levels and reorder rates. You can’t answer any of these questions from a spreadsheet, but they all impact revenue growth and the forecast you create for it. You’ve got to get out there and really look at the company.
Here are some critical example questions you’re going to want to ask when valuing a company:
- What are the constraints to sales growth?
- What’s the company’s growth plan?
- Is the company’s market share rising?
- Has the management team completed a thorough market analysis? How well do they understand the competitive landscape?
- Has the management team determined the attractiveness of markets and segments? What about size, trends, growth, and profitability?
- Does the brand clearly articulate what the company provides to the market?
The concepts behind these questions are what you need to ask to help you look in-depth into a company. It’s not about the algorithms and calculations you’re using or even the complexity of the valuation framework you have. To make sure you don’t make the mistake of an over-optimistic revenue forecast, you need to do more research on the company you’re analyzing.
Switching into finance from another field?
Our Switcher Program is designed for career changers who need to build credibility fast — no finance background required.
A Step-by-Step Framework for More Accurate Revenue Forecasts
Beyond asking the right qualitative questions, here is a structured process to reduce forecast bias in your valuation models:
- Start with the base rate. Before forecasting, look at long-term average revenue growth for the industry and the company. Aswath Damodaran’s industry data provides revenue growth benchmarks by sector. Most companies revert to industry averages over time.
- Use driver-based modeling. Don’t forecast a single revenue number. Break revenue into its components: volume x price, or customers x average revenue per user, or market size x market share. This forces you to justify each assumption individually rather than picking an aggregate growth rate.
- Build your model before checking consensus. If you look at other analysts’ estimates first, you’ll anchor to them. Form your independent view, then compare. Differences between your model and consensus highlight where your assumptions diverge — and which assumptions need more scrutiny.
- Stress-test with scenarios. Create three cases: base, bull, and bear. The bear case should reflect what happens if the company’s growth plan fails. If your bear case still shows strong growth, you’re probably being too optimistic. Consider what the impact of a declining business model would mean for your revenue assumptions.
- Apply mean reversion. High growth rates don’t last forever. Forecast a gradual fade toward industry or GDP growth rates over your projection period. The further out your forecast extends, the closer it should converge to long-term averages. This connects directly to how you fade returns on invested capital in your terminal value calculation.
- Get out from behind the spreadsheet. As Dr. Stotz emphasizes, you can’t forecast revenue accurately from financial data alone. Talk to customers, visit stores, and understand the sales process. The companies that surprise analysts most often do so because the qualitative picture changed before the numbers did.
Key Takeaways
Overly optimistic revenue forecasts remain the most common and consequential valuation mistake. Here’s what to remember:
- If revenue is wrong, everything is wrong. Revenue drives profit margins, capital expenditure needs, working capital requirements, and ultimately free cash flow. A 10% revenue error compounds through every line of your model.
- The bias is systematic, not random. Analysts aren’t just making mistakes — they face structural incentives to be optimistic. Knowing this, you can adjust your process.
- Qualitative research is your edge. Understanding the business behind the numbers — marketing efficiency, customer retention, competitive positioning — gives you insight that spreadsheets alone can’t provide.
- Use a structured process. Base rates, driver-based models, independent analysis before consensus, scenario testing, and mean reversion are your best tools against forecast bias.
- Curb your enthusiasm. When your forecast looks dramatically better than history, that’s a signal to question your assumptions, not celebrate your insight.
Check out the full video here:
In the next blog, I’ll be discussing how underestimating expenses causes unrealistic profit forecast. Check it out now!
Frequently Asked Questions About Revenue Forecast Mistakes
Q: Why do analysts make overly optimistic revenue forecasts?
A: Analysts overestimate revenue for both structural and psychological reasons. Structurally, sell-side analysts face pressure from employers to issue positive coverage that generates trading volume and maintains corporate relationships. Psychologically, recency bias, anchoring, and confirmation bias all push forecasts upward. Research shows a consistent 10-15% optimistic bias across major Asian markets.
Q: How accurate are analyst revenue forecasts on average?
A: Research on the 540 largest companies in Asia found that analyst revenue forecasts have an average absolute error of approximately 10%. The error tends to be skewed toward optimism, with an estimated 15% upward bias. Forecast accuracy deteriorates significantly for cyclical companies, where consensus estimates consistently fail to predict revenue turning points.
Q: What is recency bias in financial forecasting?
A: Recency bias is a cognitive tendency to assume that recent trends will continue indefinitely. In revenue forecasting, this means analysts extrapolate recent growth rates into the future without accounting for mean reversion, market saturation, or competitive threats. An analyst seeing three years of 20% growth may forecast 20% going forward, even when the long-term industry average is 5%.
Q: How does an overly optimistic revenue forecast affect valuation?
A: Revenue is the top line that drives every other item in a financial model. An overestimated revenue forecast inflates projected profit margins, overstates free cash flow, and produces an inflated discounted cash flow valuation. Since many valuation models project 5-10 years of cash flows plus a terminal value, even a small annual revenue overestimate compounds into a large valuation error.
Q: What is the best way to forecast revenue for cyclical companies?
A: For cyclical companies, avoid extrapolating recent growth rates. Instead, use normalized revenue over a full business cycle (typically 5-10 years), apply industry benchmarks, and stress-test assumptions against historical downturns. Consensus estimates are notoriously unreliable for cyclical sectors because they tend to be too optimistic at cycle peaks and too pessimistic at troughs.
Q: Where can I learn to build accurate valuation models with hands-on practice?
A: The Valuation Master Class Boot Camp teaches a systematic approach to company valuation with real company data. Participants build complete financial models, learn to identify and avoid common forecasting errors, and graduate with four real-world valuation reports. The program is designed for career starters, mid-career advancers, and career switchers.