Mistake #9: Not Properly Fading the Return on Invested Capital

We’ve covered a lot over the past Top 8 Valuation Mistakes. Don’t forget to read all these great posts here first:
But first, don’t forget to catch up with the rest of the articles here.
The Top 9 Valuation Mistakes
- Overly optimistic revenue forecasts
- Underestimating expenses causing unrealistic profit forecasts
- Growing fixed assets slower than revenue
- Confusing growth with maintenance Capex
- Forecasting drastic changes in the cash conversion cycle
- Underestimating working capital investment
- Valuing a stock using the calculated Beta
- Choosing an unreasonable cost of equity
- Not properly fading the return on invested capital
The final mistake, #9, takes us into when analysts don’t properly fade the return on invested capital.
Now, most analysts forecast that high-return companies will maintain high-level profits and low-return companies will retain their low-level ones. When I talk about return, we could be talking about return on assets; we could be talking about return on invested capital, and we could be talking about return on equity. In this study, I’m using return on invested capital (ROIC).
It’s almost impossible for a firm to maintain a high level of profitability forever or to have losses forever. The management is going to change. The shareholding structure is going to change. There will be some element in the company’s future that is going to change. Therefore, fading the ROIC down or up—in the case of a low profitability firm—accurately reflects the idea that firms cannot sustain excess returns to infinity.
Let’s look at a study that I’m going to present here.
Calculating ROIC
We analyzed 13,000 companies—from a universe of 26,000—because those are the ones that had the data available at that time. And we looked at ten different sectors to understand how ROIC for a company changes over time.
The decay analysis that we did was performed by sorting firms into deciles and tracking the average ROIC for these ten portfolios.

[Fig. 9.1 Stocks Ranked by ROIC Deciles with Future Calculated ROIC]
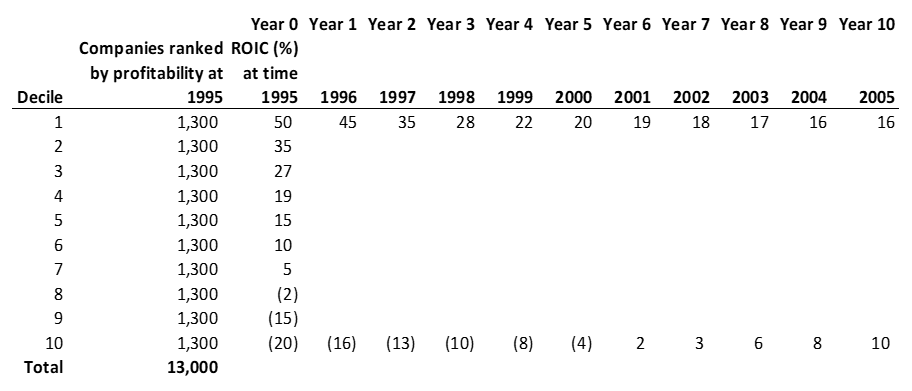
Fig. 9.1 shows you an example of the structure of how we laid out this report. We’re looking at 13,000 stocks in the year 1995. So, we broke them into deciles—ten different groups—each of them with 10% of the total stocks. What really matters to us is the highest decile and the lowest decile. Decile #1 goes from 50 to 45 to 35 to 28 all the way down to 16. And at the other end of the spectrum, the negative, the worst stocks at #10. They’re starting in 1995 at -20; but then, what happened? We can see it went to -16, -13, and then all the way to a positive 10. So, we’re seeing a convergence that’s happening there. This is hypothetical, but this is exactly how we laid that out.
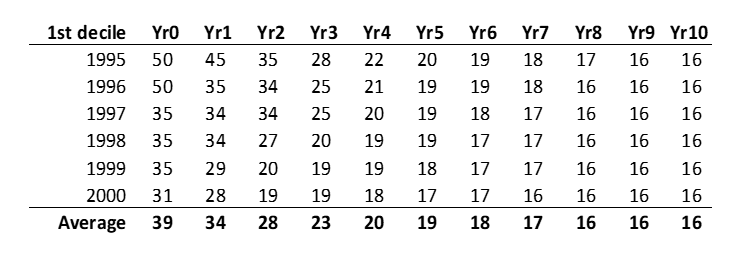
Now, of course, we don’t really need to look at all the different deciles. Let’s just look at the 1st decile, the 5th decile which is the average, and the 10th decile in Fig. 9.2.

[Fig 9.2 A Focus on the Most Profitable Groups, the Least Profitable, and the Average]
Then, we go to 1996 and we do the exact same study; and then, in 1997, the exact same study, and on and on like that as far as we can go to have ten years of forward data. Then we stagger the results, remove the actual years, and replace with ‘Year Zero’, etc. This allows us to take an average—in this case, an average of Year Zero. The starting point is 39% of ROIC for high-return companies and that fades down, on average, to 16.

[Fig. 9.3 Average Fading ROIC Data]
Global ROIC
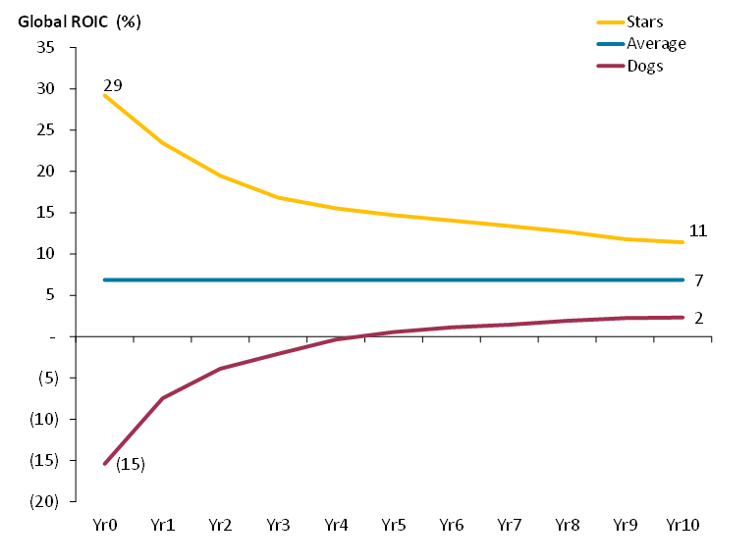
The actual findings are essential for valuation as one option of dealing with the fade and terminal period is to fade the profitability. Here are the actual Global ROIC results below (Fig. 9.4) and that shows that profitability is mean reverting. We can see that the highest group of stocks, the “Stars,” we called them, Decile 1, has an ROIC of 29% and that fades down to 11. And we can see that the lowest group, the “Dogs,” has an ROIC of negative 15% and that fades up to 2. We can also see from this that Stars remain above the average and the Dogs remain below the average.

[Fig 9.4 Global ROIC]
So, you could say that once a star, always a star. But a star falls within three years. So be careful when you’re forecasting. Make sure that you are fading up or down accordingly. But you don’t need to necessarily fade to the mean.
Is Profitability Mean Reverting?
Very profitable firms decrease in profitability, and low profitability firms increase in profitability. However, none of them reverts completely back to the mean. Stars stay Stars, and Dogs stay Dogs so to speak. It’s an important distinction to make here. Right now, what we’re talking about is the average return on invested capital for one industry. This is an overall study, but we can look at a company’s average return on invested capital for the industry.
But for forecasting, we would need to look ahead ten years and get that correct forecast for ten years to know, “What are we fading to? What is the ROIC at that 10th year?” Nobody knows that. As a result, rather than fading the ROIC, I use a substitute which is: Fading to the weighted average cost of capital.
In the ValueModel framework, we allow a fade of return on invested capital (ROIC) to a 20% premium to the WACC for very profitable firms and to a 20% discount to the WACC for quite unprofitable firms. Average firms need no fading. Fading to industry average ROIC is nearly an impossible task because we don’t have that data and it would be impossible to get it. So, we replace it with the company’s WACC.
Mistake #9 Conclusion
- Fading ROIC to WACC reflects the idea that firms cannot sustain excess returns to infinity.
- Also, very profitable firms decrease in profitability, and low profitability firms increase in profitability.
- Finally, fade highly profitable firms to 20% premium to WACC and unprofitable firms to 20% discount. No fading is required for average ROIC firms.
Don’t forget to watch the video that accompanies this chapter:
There you have it, the full Top 9 Valuation Mistakes that I have seen in my 20 years as an analyst and a head of research. Sharing this journey with you has been great. Thank you for reading.
The Valuation Master Class is an on-demand online course that trains attendees to become company valuation experts. Graduates can confidently value any company and possess the in-demand industry skills needed to succeed as investment bankers, asset managers, equity analysts, or value investors.
Click here to learn more about Valuation Master Class Foundation.
The Valuation Master Class Boot Camp presents the Valuation Master Class Foundation material in a 6-week guided online course format. Daily live sessions, teamwork, progress tracking, and the intensive nature help guide attendees to completion. The final company valuation project and presentation is tangible evidence of the attendee’s practical valuation experience and dedication to building a career in finance.
